TLDR;
This video explains the Candle Range Theory (CRT) and how it can be used to predict the next candle's movement. It covers various CRT formations, including the three-stick CRT, Stop and Go model, and Candle Impulse Theory (CIT). The video also discusses how to use CRT in conjunction with other tools like SMT divergence and high time frame analysis to increase confidence in predictions. Additionally, it touches on how to predict the direction of news events and avoid fakeouts.
- CRT is based on understanding that every candle has a range, and previous candles' highs and lows act as liquidity draws.
- The video provides examples using fast.com charts, which allow for tiled windows to monitor multiple charts simultaneously.
- Key models discussed include the three-stick CRT, Stop and Go, Candle Impulse Theory, and delayed response model.
Intro - What is a CANDLE RANGE THEORY(ICT CRT MODEL) [0:00]
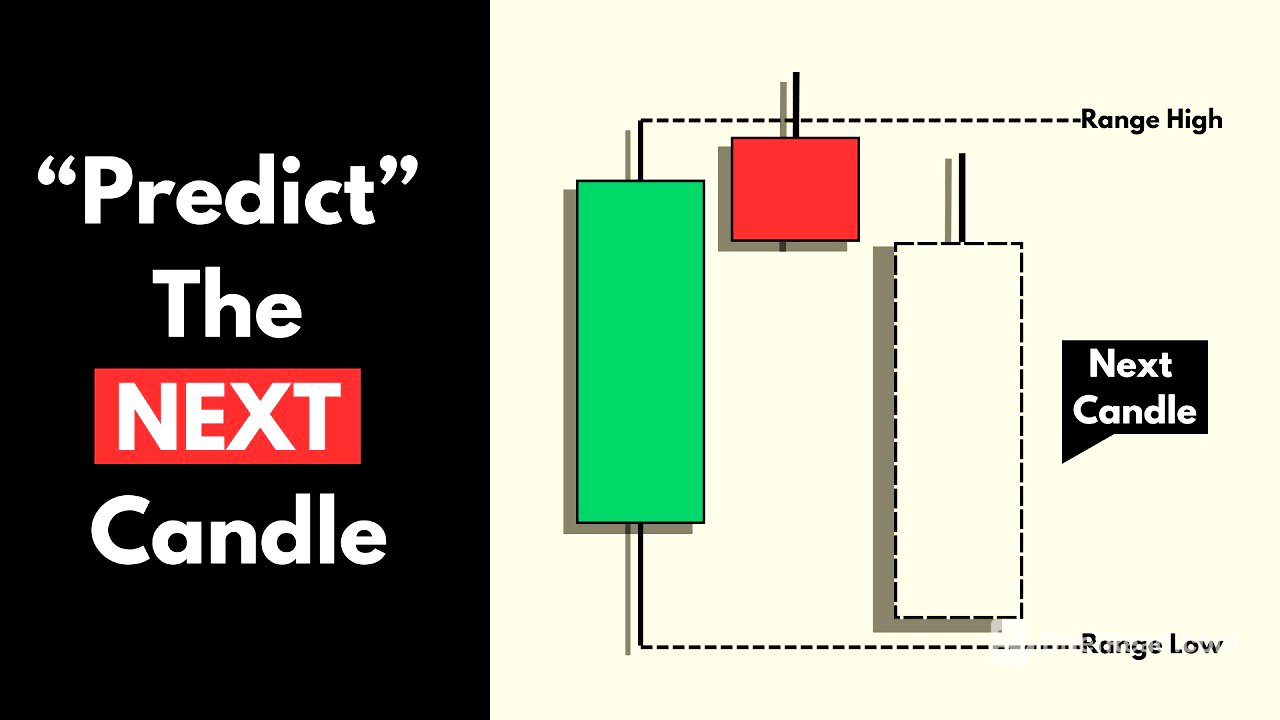
The Candle Range Theory (CRT) is introduced as a method to predict individual candle movements by understanding that each candle forms a range. The high and low of previous candles serve as potential areas of liquidity. Sweeping these lows can indicate a liquidity grab, with the subsequent high acting as the target.
3 stick CRT Formation [0:45]
The three-stick CRT formation, a stop and reverse model, begins with an impulse candle following a bullish trend. The high and low of this candle are marked. If the next candle wicks and rejects above a certain high point, especially if it aligns with a high time frame value gap or order block, the subsequent candle is likely to be bearish, signaling a reversal.
Stop n GO' CRT Trading Entry Model [1:43]
The Stop and Go model involves identifying an impulse candle within a bullish trend and marking its high and low. The "stop" is a minimal bearish candle, representing a pullback. The next candle is expected to be bullish, continuing the preceding trend, similar to a normal impulse, retracement, and new impulse pattern.
Candle Impulse Theory (CIT Trade Model) [2:37]
The Candle Impulse Theory (CIT) focuses on candle ranges. If the low of a candle range is taken out, a lower time frame bullish entry model can validate a long position that aims to break the range high. This model suggests that taking out liquidity increases volatility, making a bullish next candle probable.
Double Sided Candle Predictions with crt ict [3:20]
The presenter uses fast.com charts to demonstrate CRT, utilizing the tiled windows feature to monitor S&P and NASDAQ for SMT divergence. Examples show marking candle range highs and lows on both charts. When a candle breaks both the high and low of the previous candle, the context of the trade, such as tapping into a previous point of interest (POI) or following a bearish trend, helps determine if the next candle will be bullish or bearish.
Know the Next Candle Before It Prints CIT ict [7:00]
The Candle Impulse Theory is further explained, noting that in a bullish trend, if the previous two candles have been bullish, the third candle is also likely to be bullish. To capitalize on this, traders should wait for a dip below the closing price of the previous candle and then look for an entry model on a lower time frame to target the high.
How to Predict Direction of News [8:13]
The delayed response model is discussed, which often occurs just before major news events like NFP or FOMC. Price consolidates within a range, and the direction of the breakout indicates the likely direction of the next candle. Breaking the low suggests a bullish candle, while breaking the high suggests a bearish candle.
How to Avoid fake outs [9:15]
The three-candle anomaly is presented as a fakeout pattern, a variation of the stop and reverse model. It induces traders into false sells. Lower time frame CRT evaluation is needed to determine if it's a genuine CRT reverse or a continuation model. Added confidence can be gained by assessing if price has tapped into a POI and by analyzing entry models on lower time frames.
Predict the next candle direction (Test) [9:51]
Examples are provided to predict the next candle direction using the discussed formations. If three consecutive bearish candles break the previous candle's low, the next candle is likely to be bearish. Sweeping a previous candle range low without taking out the high suggests the next candle will be bullish. A stop and go model indicates the next candle will follow the previous bullish trend.
SECRET WAY TO BE AHEAD OF THE MARKET [13:02]
Using fast.com's tiled window feature, the presenter looks at GBP/USD and USD for SMT divergences or correlations. Observing four consecutive bullish candles suggests continuation based on the CIT model. An impulse stop and go model indicates the price will break the previous candle high and continue higher, following the bullish trend.
EXTRA COURSE TIPS... [14:23]
The delayed response model is revisited, showing price consolidating before a major news event and then making a significant move to the upside. This initial move is followed by an impulse stop and reverse pattern, leading to a bearish candle.