TLDR;
This video explains the concept of the supply curve, illustrating how the quantity of a good that suppliers are willing to provide changes with its price. It uses the oil market as an example, explaining why the supply curve slopes upward due to varying extraction costs. The video also touches on how suppliers enter or exit the market based on price levels and extraction costs.
- Supply curve illustrates the relationship between price and quantity supplied.
- Higher prices generally lead to a greater quantity supplied.
- Extraction costs vary globally, influencing supplier profitability at different price points.
The Supply Curve [0:00]
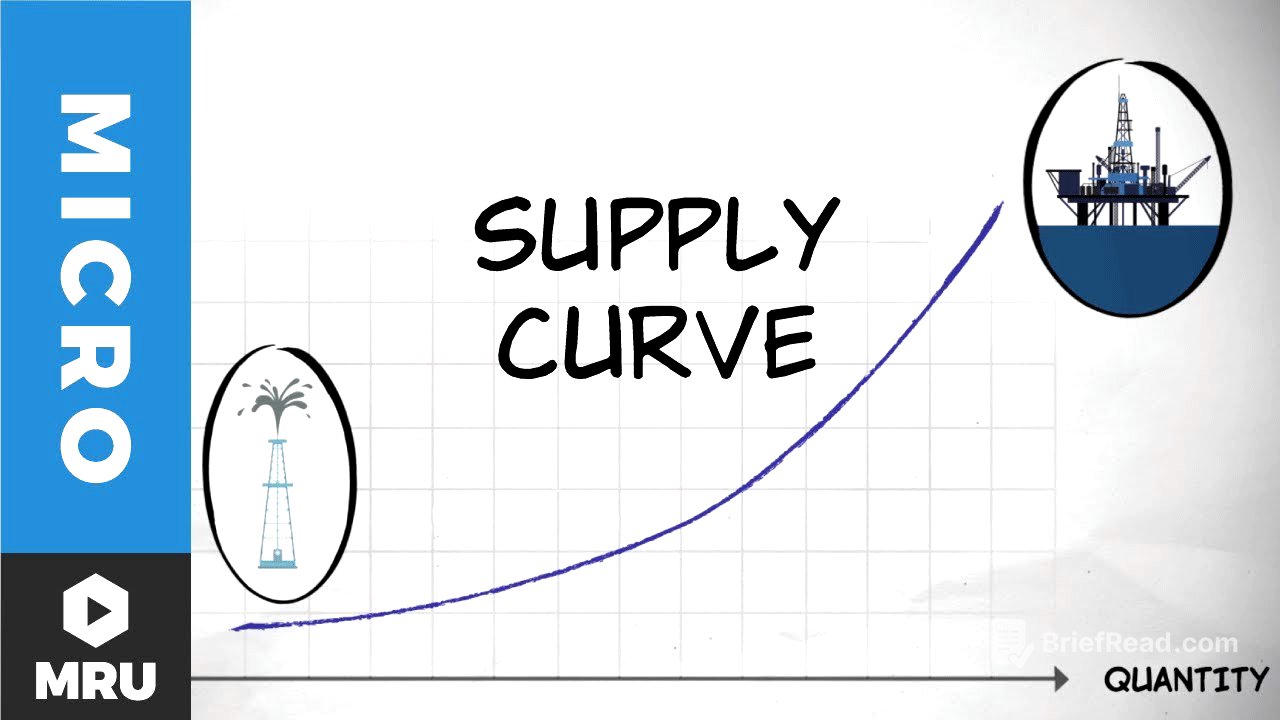
The supply curve illustrates the quantity of a good that suppliers are willing and able to supply at different prices. Similar to demand curves, a supply curve exists for every good and service. The supply curve for oil demonstrates an intuitive relationship: as the price of oil increases, the quantity that companies are willing to supply also increases.
Example - Supply Curve for Oil [0:38]
At a low price of $5 per barrel, approximately 10 million barrels of oil are supplied daily. When the price increases to $20 per barrel, the quantity supplied rises to 25 million barrels. At $55 per barrel, 50 million barrels are supplied. This illustrates the general principle that a higher price incentivizes a greater quantity supplied.
Expensive vs. Cheaper Sources of Oil [1:00]
Oil extraction costs vary significantly worldwide. In places like Saudi Arabia, extraction is relatively inexpensive, costing around $2 per barrel. In contrast, oil extraction in the US, such as in Alaska, is more costly, at least $10 per barrel. Oil extraction from deep-sea oil rigs like the Atlantis rig in the Gulf Coast is the most expensive, requiring drilling over a mile underwater.
Example - Supply Curve for Oil continued [1:30]
When oil prices are low, only suppliers with low extraction costs, like Saudi Arabia, can operate profitably. As prices increase, suppliers with higher extraction costs in regions like Nigeria, Russia, and Alaska become profitable and enter the market. At even higher prices, the most expensive extraction methods become viable. The upward slope of the supply curve reflects the need to exploit increasingly costly sources to increase the quantity of oil supplied. The supply curve summarizes how suppliers respond to price changes, including their decisions to enter or exit the market based on profitability.