TLDR;
This video presents ten trading indicators that can be used to improve trading strategies when combined with price action analysis. It covers volume profiles, stochastic oscillators, Donchian channels, anchored VWAP, Bollinger Bands, MACD, Ichimoku Cloud, Fibonacci retracements, RSI, and exponential moving averages. The video explains how each indicator works, how to interpret its signals, and how to combine it with other price action methods to identify high-quality trade opportunities.
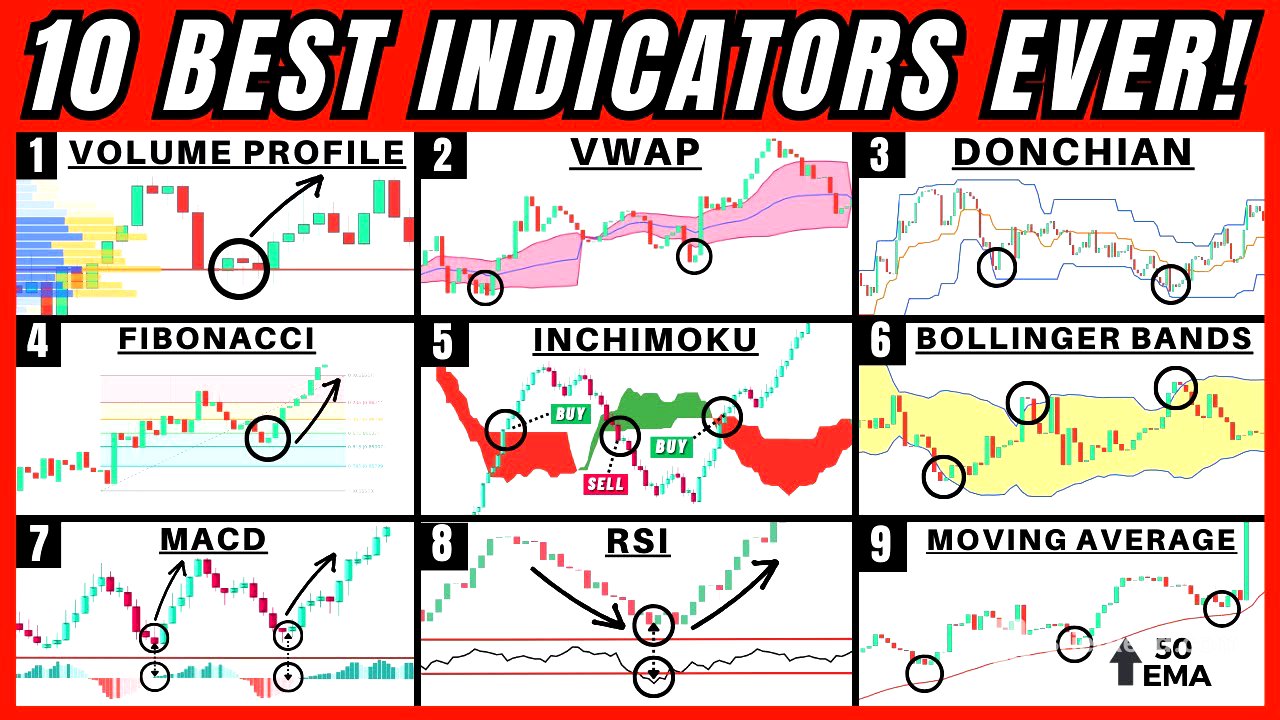
- Volume profiles help identify key price levels based on trading volume.
- Stochastic oscillators can signal overbought or oversold conditions and trend changes.
- Donchian channels are useful for identifying trends and potential reversal points.
- Anchored VWAP provides insights into market trends and potential support/resistance levels.
- Bollinger Bands help identify market volatility and potential overbought/oversold entries.
- MACD can gauge and confirm trend changes or continuations.
- Ichimoku Cloud offers insights into market direction, momentum, and potential support/resistance.
- Fibonacci retracements help identify areas of value within a trend for potential trade entries.
- RSI is used for identifying overbought or oversold markets and divergences.
- Exponential moving averages (EMA) help visualize price movement and confirm trends.
Volume Profiles [0:25]
Volume profiles indicate the amount of trading volume at specific price levels, with the anchored volume profile being a key variant. High trading volume at a price level suggests significant buyer and seller interest, making these levels potential trade entry and exit points. The point of control, the price level with the most trading volume, is particularly important. Combining volume profiles with price action methods, such as key levels, enhances trade setup identification. Session volume profiles are useful for day traders, as they reset with each trading session, enabling quick trading entries.
Stochastic Oscillator [4:23]
The stochastic oscillator is a momentum indicator used to identify overbought and oversold conditions. A reading above 80 suggests an overbought condition, signaling a potential downtrend, while a reading below 20 indicates an oversold condition, suggesting a possible uptrend. The crossover method involves observing the percentage K (blue line) and percentage D (orange line) to identify momentum shifts. Divergence, where price makes a lower low while the stochastic oscillator makes a higher low, can signal higher quality reversal trade setups.
Donchian Channels [7:32]
Donchian channels consist of an upper band representing the highest high, a lower band representing the lowest low, and a middle line showing the average of the high and low. Consistent price touches at the bottom of the channel signal a strong downtrend, while touches at the top indicate a strong uptrend. Donchian channels are most effective in sideways markets, where the upper band acts as resistance and the lower band as support. Combining Donchian channels with price action methods, such as support and resistance levels, improves trade opportunities.
Anchored VWAP [9:18]
Anchored VWAP (volume-weighted average price) considers volume, unlike traditional moving averages. When price is above the VWAP line, it signals a bull market and potential support, while price below the VWAP line indicates a bearish market and resistance. Breaking through the VWAP line can signal a trend change. Pairing VWAP with price action methods enhances trade accuracy. Setting the VWAP anchor point at the start of an uptrend can highlight areas of value for potential short trade entries.
Bollinger Bands [11:10]
Bollinger Bands help identify trending versus consolidating markets by gauging market volatility. During low volatility, the bands contract, indicating a consolidating market, while high volatility causes the bands to expand, suggesting a trending market. The bands can act as support and resistance. Combining band touches with key levels and candlestick price action improves setup quality. The Bollinger Band break strategy involves looking for breaks outside the bands, with type two breaks, where the majority of the candle body is outside the band, being higher quality.
MACD Indicator [16:26]
The MACD (moving average convergence divergence) indicator tracks the relationship between two moving averages and can be used to gauge or confirm trend changes or continuations. The crossover method involves observing when the MACD line crosses above or below the signal line to identify potential trend changes. The histogram method uses the size of the histogram bars to gauge price momentum. Divergence between price and the MACD indicator can act as an early signal of a possible trend change.
Ichimoku Cloud [20:27]
The Ichimoku Cloud provides insights into market direction, momentum, and potential support and resistance. When price is above the cloud, it signals a bullish market, while price below the cloud indicates a bearish market. The distance between price and the cloud gauges momentum. Breaking through the cloud can confirm a trend change. The cloud can also act as support and resistance. Combining an Ichimoku Cloud break with a pullback entry can create higher quality trade setups.
Fibonacci [30:56]
Fibonacci retracement levels act as support and resistance, representing areas of value within a moving trend. The 50% Fibonacci level is considered good, the zone between 50% and 61.8% is great, and 61.8% is best for identifying deep pullbacks. Treat Fibonacci levels as areas, not solid lines, and combine them with price action. In an uptrend, click at the recent swing low and drag it up to the recent swing high to identify Fibonacci levels. Combining Fibonacci levels with support and resistance areas enhances trade setup quality.
RSI Indicator [37:49]
The RSI (relative strength index) is used to identify overbought or oversold markets. A reading at or above 70 indicates an overbought region, while a reading at or below 30 indicates an oversold region. The RSI can also be used to find divergences, where price makes a higher high while the RSI makes a lower high, signaling a potential reversal.
Exponential Moving Average [39:58]
The exponential moving average (EMA) removes random price fluctuations, providing a cleaner visualization of price movement. Common EMA settings include 50, 100, and 200. In a downtrend, price trending below the EMA confirms bearish momentum, while in an uptrend, price trending above the EMA confirms bullish momentum. The EMA can act as resistance or support. Combining the EMA with areas of confluence enhances entry quality.