TLDR;
This video explains the Candle Range Theory (CRT), a concept within ICT trading that focuses on understanding and capitalizing on the range formed by individual candles. It covers identifying correct CRT models, optimal entry strategies based on candle anatomy, suitable time frame combinations, and specific trading times for the CRT model. The video emphasizes that CRT should be used as a confluence with other ICT concepts like Turtle Soup and AMD (Accumulation, Manipulation, Distribution) for higher probability trades.
- CRT is based on understanding the range (high and low) formed by each candle.
- Key models include the "tap and go" and "stop and go/reverse" patterns.
- CRT should be used with other ICT concepts like Turtle Soup and AMD.
- Optimal trading times are during New York and London kill zones, focusing on specific hourly candles.
Intro - What is a CANDLE RANGE THEORY(ICT CRT MODEL) [0:00]
The Candle Range Theory (CRT) is presented as a key concept in ICT trading, emphasizing that every candle creates a range within a specific time frame. The goal is to identify and trade the liquidation of the highs and lows of these candle ranges. The video aims to teach viewers how to select the right CRT models and maximize their trading potential, focusing on three main models and the correct entry methods based on candle anatomy. Additionally, the video will cover time frame combinations and optimal trading times for the CRT model.
ANATOMY OF CANDLE [0:39]
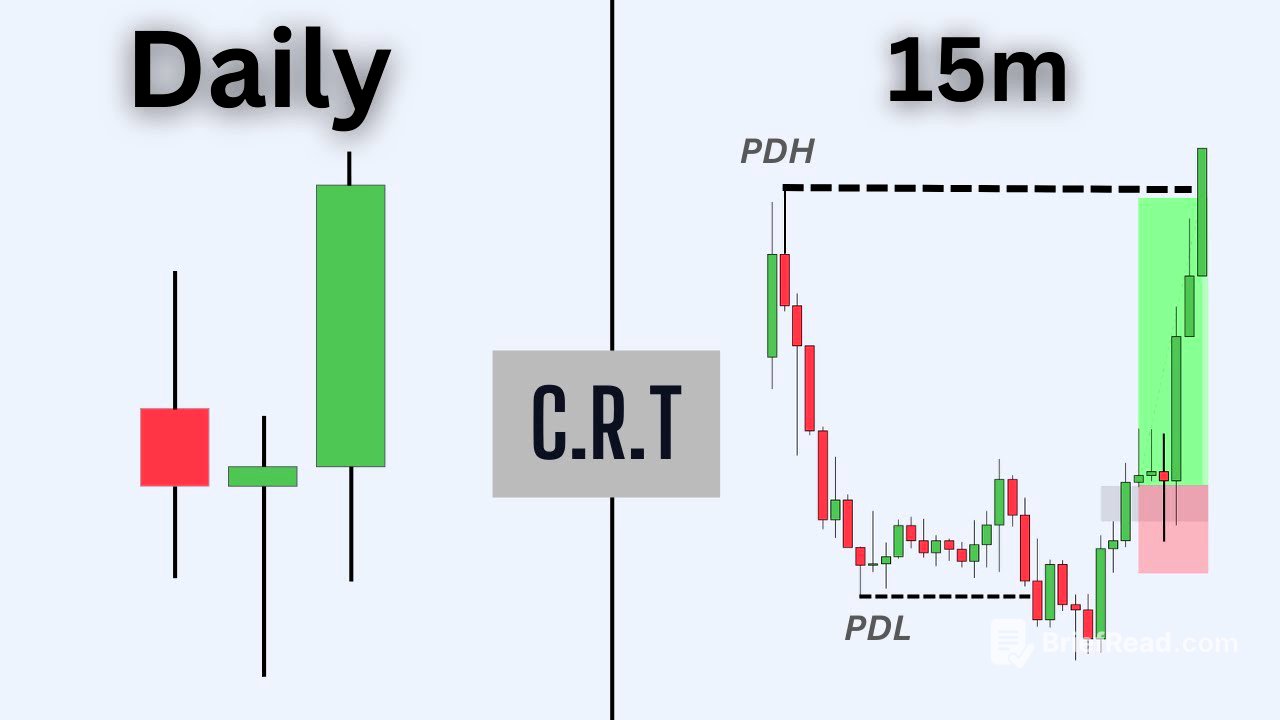
The anatomy of a candle is explained using a bullish candle as an example, where the low, high, opening price, and closing price are identified. It's noted that lower time frame ranges can be found within a single candle's range on a higher time frame. For example, a 3:00 a.m. one-hour candle might show accumulation, manipulation, and distribution patterns on a five-minute chart. The importance of understanding the Power of 3 model in conjunction with the CRT model is highlighted. The price action within a candle represents the entire price movement within that specific time period.
WHERE TO USE THE CRT(CANDLE RANGE THEORY) [1:27]
The CRT model should not be used in isolation but as a confluence with other trading tools. The framework involves understanding the inside bar model, where a main candle contains all the price action. The focus is on the range high and low of this candle. To maximize the model's potential, it should correlate with a Point of Interest (POI) that price seeks to tap into while also taking out a range high. From there, price bounces to a draw on liquidity, which forces price to take out the range low.
A MUST FOR EVERY CRT [2:11]
An example of an evening star candle range theory model is presented. The first candle breaks above the range high, and the expectation is for price to distribute to the range low. The CRT model seeks to liquidate both range highs and lows. If price only takes out the range high but doesn't reach the range low, it's because there's a higher intention for price to reach, such as a bearish order block. After price takes out the range high and taps into the bearish order block, it then looks to trade back down into the range low.
THE MOST HIGH PROBABLE CRT MODEL [2:51]
The "tap and go" model is introduced, where price doesn't always liquidate the range low before targeting the range high. Instead, price may minimally open and tap the 50% level of the candle before targeting the range high. This model is effective in aggressive markets where price is unlikely to fully reverse to take out the range low before continuing higher. In a bullish market, the lows are typically protected. The tap and go model should be implemented to select the perfect model for the current market scenario.
2 MAIN CANDLE RANGE THEORY MODELS [4:37]
Two main CRT models are highlighted: the "stop and go" and the "evening star" pattern. The "stop and go" model involves price impulsing downward, retracing, and then wicking above before continuing the downward impulse. The "evening star" pattern starts with a large bullish candle, inducing buys into the market. This pattern works best with a Point of Interest (POI), where price pushes into a bearish order block, gets rejected, and then distributes downward. Range highs in this pattern act as turtle swoops.
FOCUS ON THESE CRT SCHEMATICS [5:31]
The schematics of the "stop and go" and "stop and reverse" models are further explained. The "stop and go" model involves price making a retracement back up to liquidate a short-term high before continuing downward. The "stop and reverse" model must be used in confluence with a higher time frame target of a draw on liquidity. Price pauses at a premium, causing a small bearish candle before distributing down to the draw on liquidity. Examples are provided to illustrate how these models appear on lower time frames, emphasizing the importance of the second candle closing within the range for higher probability.
TRADING POWER OF 3 WITH CRT (AMD MODEL) [8:09]
The CRT model is used in conjunction with other ICT models like Turtle Soup and AMD (Accumulation, Manipulation, Distribution). The AMD model can form within a single candle or across three candles, as seen in the evening star pattern. The formation of wicks in the candles indicates quick price movements and reversals. By investigating these models on lower time frames, traders can understand how the candles are formed and how price action plays out, reinforcing their trades. The AMD model is illustrated with examples, showing how the range high is liquidated first, followed by the range low in a bearish scenario.
How To Get Better Entries [10:28]
To get better entries with the CRT model, traders can use the turtle soup entry or lower time frame CRT models. Targeting the 50% level of the candle for partial profits is a safe bet, as price often reaches this level. The process involves price accumulating, manipulating, and then distributing, allowing traders to enter and exit the market efficiently.
LIVE EXAMPLE OF CRT TRADE [11:01]
A live example of a CRT trade taken on NASDAQ (NQ) is presented, demonstrating the model's use in a valid environment with multiple confluences. These confluences include a Point of Interest (POI) and price turtle swooping a major liquidation low. The formation of a big bearish candle followed by a wick and then a rally indicates a stop and go pattern. The entry is aimed at the third candle, where volatility starts to kick in.
BEST CRT CONFLUENCE [12:04]
The best CRT confluence involves using a lower time frame CRT within a higher time frame CRT. For example, an hourly candle creates an inside bar pattern, containing all the price action. Traders wait for the high or low to be broken before trading in either direction. When price breaks above the high, it distributes to at least the 50% level. This pattern is visible on lower time frames with range highs and lows. The three-candlestick formation of the CRT is characterized by a big chunky candle, followed by a thin indecisive candle, and then a major distribution candle.
SECRET WAY TO VALIDATE YOUR CANDLE RANGE THEORY [13:09]
A secret way to validate CRT models is to use SMT (Smart Money Technique) divergence. If ENQ (E-mini Nasdaq 100 Index Futures) is creating an inside bar pattern, traders should check ES (E-mini S&P 500 Index Futures) to see if it has taken out the high. If ES has taken out the high, traders can look for a 50% delivery pattern and target the range low or 50% of that high.
BEST LIQUIDITY LEVELS FOR YOUR CRT [13:28]
The best liquidity levels for CRT models are found at wick rejection points. These points act as perfect liquidity points to be purged before targeting the opposite side. For example, if price makes a wick below a range low, traders can look to enter long and target the range high.
WHEN TO TRADE CRT (TIMES) [14:05]
When trading CRT, focus on specific time candles during the New York and London kill zones. Traders should analyze the hourly time frame to see what the 3 a.m., 9 a.m., and 10 a.m. candles are printing. If these areas have been purged, traders should look for other confluences, such as a bearish PDA (Premium Discount Array) that price is looking to tap into, or a draw on liquidity that price can target.
WHAT TIMEFRAMES TO TRADE ON [14:36]
For time frame combinations, traders can use the monthly to daily time frames for lower time frame complexity. Other combinations include weekly to 4-hour, daily to 1-hour, and 4-hour to 5-minute. The 1-hour time frame is suitable for scalping positions. Traders should analyze the 3 a.m. and 9 a.m. candles on the hourly time frame to identify range highs and lows. If price creates a POI below the range low, traders can go to a lower time frame to look for manipulation below the range low and then distribution to the upside, targeting the range high.
EXTRA TIPS... [15:28]
The CRT model is described as closely resembling the "holy grail" of trading because it focuses on candlesticks. The video recommends watching a previous video on Turtle Soup to enhance the validity of CRT models. The presenter encourages viewers to join the Discord server for live setups of the CRT model and to participate in live streams where the model will be traded.