TLDR;
This video explains how to use moving averages and the MACD indicator to improve trading strategies. It covers the importance of technical indicators, different types of moving averages (SMA and EMA), and how to use them on different time frames. The video also discusses multi-time frame alignment and the significance of volume and moving average convergence divergence (MACD) in identifying trading opportunities and avoiding false breakouts.
- Technical indicators provide context to current price relative to historical data.
- Moving averages act as support and resistance levels.
- The MACD indicator helps identify optimal trading windows and avoid false breakouts.
Introduction to Moving Averages [0:00]
The video introduces moving averages as essential technical indicators for traders across various markets like futures, forex, cryptocurrency, and stocks. These indicators provide context to the current price by showing its historical performance. The presenter emphasizes that understanding these indicators is crucial for recognizing buy and sell signals, which forms the basis for successful trading.
Understanding the 200-Period Moving Average [1:32]
The presenter explains the significance of the 200-period moving average, a widely respected level of resistance or support on stock charts. When the price is below this average, it acts as resistance; when above, it acts as support. The 200-period moving average is calculated by averaging the closing prices of the last 200 periods (days on a daily chart), making it a long-term indicator.
Simple Moving Average (SMA) vs. Exponential Moving Average (EMA) [4:32]
The video differentiates between Simple Moving Averages (SMA) and Exponential Moving Averages (EMA). SMA calculates the average price over a set period, while EMA weights recent prices more heavily, making it more responsive to recent price changes. Active traders often prefer EMA for its quicker response, while SMA is still respected, especially among beginner traders. The presenter uses both on the daily chart, with SMA as a dotted line and EMA as a solid line, to account for the different groups of traders who respect each indicator.
Multi-Time Frame Alignment [10:32]
The presenter discusses the importance of multi-time frame alignment, using a trading platform with daily, 5-minute, 1-minute, and 10-second charts. Each chart displays moving averages, including the 200, 20, and 9 EMAs. The volume-weighted average price (VWAP), an intraday indicator, shows the average price of a stock, factoring in volume. The presenter explains how the price relative to VWAP and the 200-period moving average indicates market control by bulls or bears.
Applying Moving Averages in Real-Time Trading Scenarios [13:38]
The presenter illustrates how moving averages are used in real-time trading, particularly during news-driven events. He describes analyzing a stock's chart, noting the 200 moving average as a key resistance level. The presenter explains how he uses fast time frames (10-second and 1-minute charts) to assess whether the price can break through resistance, using volume as a confirmation. He also shares his strategy of buying micro pullbacks during strong trends.
Using Shorter Time Frame Indicators [18:02]
The presenter shifts focus to shorter time frame indicators like the 9 and 20 EMAs on 1-minute charts. He explains that he looks to buy dips off the 9 EMA during strong trends and considers the 20 EMA as the next support level if the price breaks the 9 EMA. The presenter also notes that breaking and holding below the 200 EMA can signal the end of a trend.
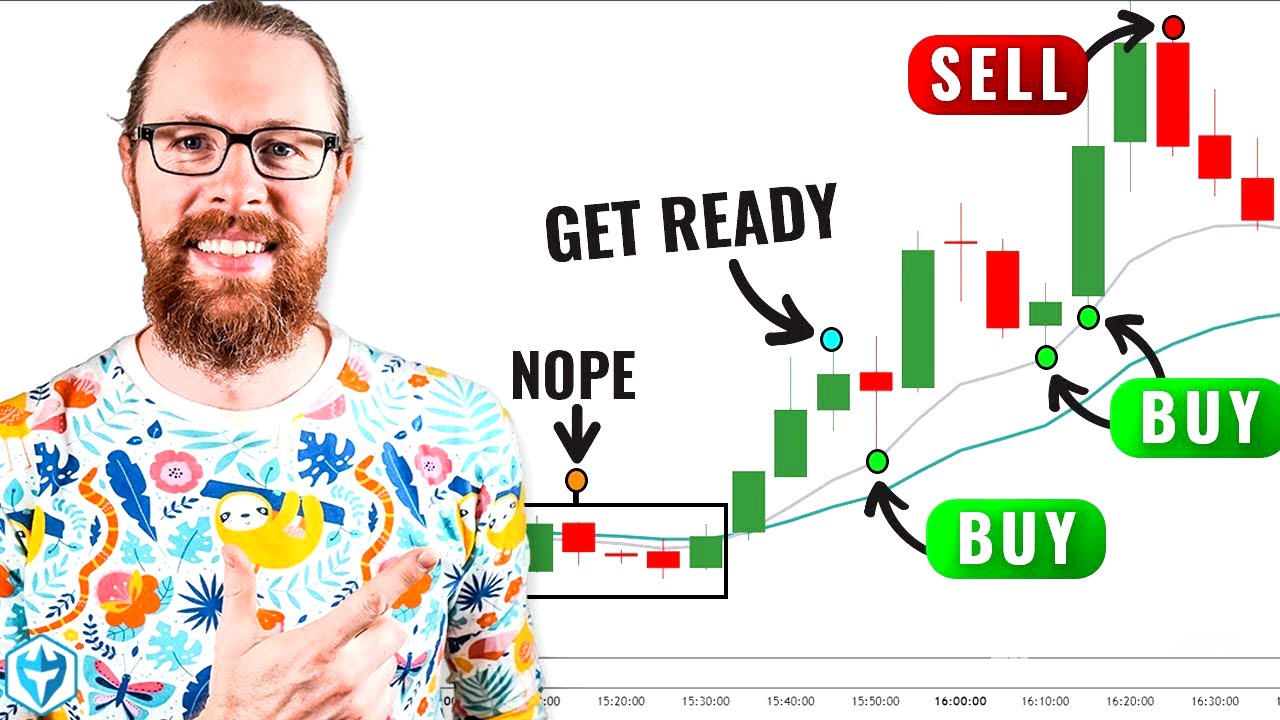
Moving Average Convergence Divergence (MACD) [19:56]
The presenter introduces the Moving Average Convergence Divergence (MACD) indicator, which shows the relationship between two moving averages. The MACD helps identify when moving averages are diverging (moving apart) or converging (coming together). The presenter explains that he focuses on trading when the MACD is above the signal line, which helps him avoid false breakouts. He adjusts the MACD settings to visually identify trading windows, using green to indicate when the moving averages are diverging positively.
Case Study: Applying Indicators to VVPR [23:44]
The presenter provides a detailed case study using the stock VVPR to demonstrate the application of moving averages and MACD in trading. He describes how he identified the 200 moving average as a key resistance level and how he used intraday time frames to watch for breakouts. The presenter also explains how he uses the MACD to confirm the strength of a trend and avoid false breakouts, emphasizing the importance of multi-time frame alignment.
Trading Strategy and Risk Management [37:04]
The presenter summarizes his trading strategy, emphasizing the importance of using the right indicators and focusing on trading aggressively when the "window" of opportunity is open. He defines this window as the early part of a move, driven by a catalyst and high volume. The presenter encourages viewers to download his micro pullback strategy PDF and to study charts to visualize future price movements. He concludes by reminding viewers that trading is risky and that managing risk is essential.