TLDR;
This video provides a comprehensive course on candlestick patterns and trading strategies applicable to Forex, stock, and cryptocurrency markets across various time frames. It aims to equip traders with the ability to time entries and exits, identify market reversals, predict turning points, and profit in both bull and bear markets. The course covers basic candlestick components, nine powerful candlestick patterns, a cheat sheet for quick pattern understanding, market structure analysis, support and resistance drawing, and a complete trading strategy with entry and exit rules.
- Candlestick patterns are essential tools for traders to understand market sentiment and potential price movements.
- Market structure, support and resistance levels, and entry triggers are crucial components of a successful trading strategy.
- The course emphasizes practical application with real-world examples to enhance understanding and skill development.
Candlestick Patterns Explained [1:13]
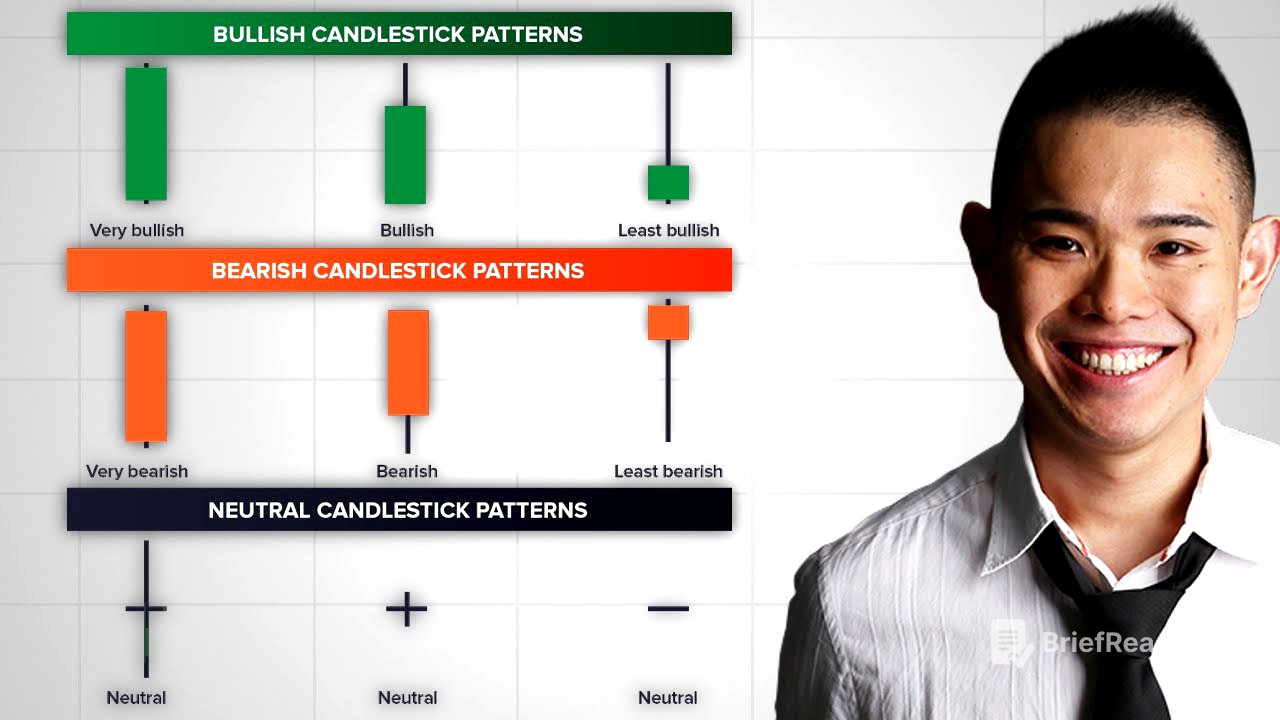
Candlestick patterns consist of four data points: the opening price, closing price, high, and low. A green (bullish) candle indicates the closing price is above the opening price, while a red (bearish) candle shows the opposite. The high and low represent the extreme price points reached during the period. These principles apply regardless of the time frame, whether it's a daily, hourly, or 15-minute chart, with each candle representing the price movement within that specific period.
9 Powerful Candlestick Patterns You Must Know [4:15]
The first candlestick pattern is the "hammer," a bullish reversal pattern that forms when sellers initially drive the price down to extreme lows, but buyers then step in to push the price back up, closing near the highs of the day. The "shooting star" is the inverse of the hammer, signaling a potential bearish reversal where buyers initially push the price up, but sellers take control and drive it back down, closing near the lows. A "bullish engulfing" pattern occurs when a green candle's body completely covers the body of the previous red candle, indicating strong buying pressure. Conversely, a "bearish engulfing" pattern happens when a red candle engulfs the body of a preceding green candle, signaling strong selling pressure.
How to Understand Any Candlestick Patterns in Less Than 5 Seconds [31:35]
A "doji" forms when the opening and closing prices are the same, indicating indecision in the market. Variations include the "dragonfly doji," a bullish signal similar to a hammer, and the "gravestone doji," a bearish signal akin to a shooting star. The "morning star" is a three-candle bullish reversal pattern, starting with a bearish candle, followed by a doji, and then a strong bullish candle. The "evening star" is the opposite, a three-candle bearish reversal pattern with a bullish candle, a doji, and a strong bearish candle.
Market Structure Secrets [39:31]
To quickly understand any candlestick pattern, first, determine where the price closed relative to the range (high to low) of the candle. This indicates whether buyers or sellers are in control. Then, assess the size of the candle compared to earlier ones to gauge the conviction behind the move. A close near the high suggests bullish control, while a close near the low indicates bearish control. Larger candles relative to previous ones signal stronger conviction.
How to Draw Support and Resistance Accurately [56:23]
Market structure consists of uptrends (higher highs and higher lows), downtrends (lower highs and lower lows), and range-bound markets. An uptrend is invalidated only when the price breaks below the swing low that precedes the breakout, while a downtrend is invalidated when the price breaks above the swing high that precedes the breakdown. In an uptrend, focus on buying opportunities, and in a downtrend, look for selling opportunities.
When to Hold and When to Fold [1:05:30]
Support is an area where buying pressure could step in, while resistance is where selling pressure could emerge. In an uptrend, identify areas where the market bounced higher to draw support levels, aiming for multiple touches. In a downtrend, identify areas where the market declined to draw resistance levels. In a range-bound market, draw support and resistance at the highs and lows of the range.
Candlestick Trading Strategy That Works [1:11:57]
Entry triggers, such as hammer, shooting star, bullish engulfing, and bearish engulfing patterns, signal when to enter a trade at an area of value. Stop-loss orders should be placed at a level where the trading idea is invalidated, away from price structure or areas of value. Take-profit levels should be set just before an area of resistance or support, capturing a swing.
How to Maximize Your Profits [1:16:40]
The "MAE" formula encompasses Market structure, Area of value, Entry trigger, and Exits. In an uptrend, identify support levels and wait for a bullish entry trigger, placing a stop loss below support and setting a target profit before resistance. In a downtrend, identify resistance levels and wait for a bearish entry trigger, placing a stop loss above resistance and setting a target profit before support.
The Advanced Candlestick Strategy [1:30:23]
For range-bound markets, determine the higher time frame trend to bias trading decisions, buying at support in a long-term uptrend or selling at resistance in a long-term downtrend. Use a trailing stop loss to capture potential trend continuations. An advanced strategy involves fine-tuning entries on a lower time frame to achieve tighter stop losses and more favorable risk-to-reward ratios.
The Truth About Trading [1:34:50]
Trading involves both winners and losers, and the "MAE" formula is not a guaranteed success. Manage expectations and practice on a demo or small account to understand the realities of trading. A free guide, "The Monster Guide to Candlestick Patterns," offers additional tips, tricks, and strategies.