TLDR;
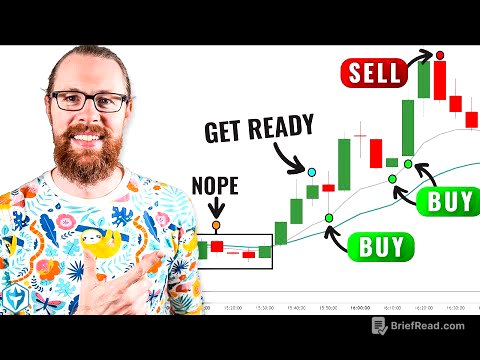
This video course provides a comprehensive guide to understanding and applying Smart Money Concepts (SMC) in trading. It covers key concepts such as market structure, change of character (CHoCH), break of structure (BoS), supply and demand zones, fair value gaps (FVG), and liquidity grabs. The course aims to equip traders with the knowledge to identify high-quality trading opportunities and avoid false signals by understanding how smart money moves the market.
- Understanding Smart Money Concepts (SMC) and their application in trading.
- Analyzing market structure, including uptrends, downtrends, and sideways markets.
- Identifying and utilizing supply and demand zones for potential entry points.
- Recognizing and trading fair value gaps (FVG) for additional entry opportunities.
- Leveraging liquidity grabs to improve trade accuracy and avoid false signals.
What You Will Learn in this Course [0:00]
The course will teach viewers about Smart Money Concepts (SMC) for trading in various financial markets. It includes understanding SMC, market structure, change of character (CHoCH), break of structure (BoS), strong and weak price levels, supply and demand, fair value gaps (FVG), and liquidity grabs. The course aims to provide a comprehensive understanding of these concepts, enabling viewers to trade SMC effectively and avoid false signals.
What is Smart Money Concepts (SMC)? [2:24]
Smart Money Concepts (SMC) are trading strategies used by knowledgeable financial professionals, such as banks, hedge funds, and institutional investors. These entities, known as "smart money," possess large amounts of capital, advanced market data, sophisticated analysis tools, and skilled analysts. Their significant capital allows them to influence market movements. By understanding how smart money operates, smaller investors can align their trades with the smart money's direction, potentially increasing their profitability.
Introduction to Market Structure [4:22]
Market structure involves analyzing past market movements to predict future ones. The market can be in one of three states: uptrend, downtrend, or sideways market (trading range). An uptrend is characterized by consistently breaking higher highs and printing higher lows. A downtrend involves consistently breaking to lower lows while staying below the highs. A sideways market, or trading range, lacks a clear uptrend or downtrend, moving without a defined direction.
Trend Analysis (Uptrend, Downtrend, Sideways Market, and Consolidation) [6:55]
In an uptrend, the market prints consecutive higher highs and higher lows. A trading range, or consolidation, can occur within an uptrend as a temporary pause. The uptrend is considered to shift into a downtrend when the price breaks below a significant low point and subsequently prints lower highs and lower lows, confirming the new trend.
Change of Character (CHoCH) and Break of Structure (BoS) [9:18]
A break of structure (BoS) occurs when the price breaks a higher high within an uptrend or a lower low within a downtrend, confirming the continuation of the current trend. A change of character (CHoCH) happens when the price breaks the most recent low in an uptrend, signaling a potential end to the trend. In a downtrend, a CHoCH occurs when the price breaks a recent high.
Internal and External CHoCH and BoS [12:58]
Change of character (CHoCH) and break of structure (BoS) are fractile, appearing on all time frames. Those on higher time frames are called external BoS or CHoCH, while those on lower time frames are internal. Upward movements on higher time frames are large uptrends on lower time frames. Traders use multiple time frames to get better entries and exits.
Strong and Weak Levels [15:52]
A strong level is derived from a move that breaks structure, while a weak level comes from a move that fails to break structure. To identify these levels, analyze the break of structure and change of character. Strong levels are significant for finding good entries in trading.
Supply and Demand (SMC Entry Model) [18:29]
Supply and demand is the force behind all price movements. For prices to increase, demand must exceed supply, and vice versa for prices to decrease. In Smart Money Concepts (SMC) trading, areas on the chart with imbalances between supply and demand are identified as supply and demand zones, which can be used to define entry levels in the market.
How to Identify SMC Demand Zones [19:37]
To identify Smart Money Concepts (SMC) demand zones, first, find a strong momentum candle, which is significantly larger than previous candles. Then, look at the candle preceding the momentum candle and draw a zone around it, from its highest to lowest point. This zone represents an area where demand is expected to be greater than supply, potentially leading to future price increases.
How to Identify SMC Supply Zones [22:08]
To identify Smart Money Concept (SMC) supply zones, the first step is to find a strong momentum candle. Next, identify the candle before the momentum candle. Then, draw a zone around the previous candle, from its highest point to its lowest point. This area is identified as a supply zone, indicating a potential area where supply may outweigh demand, leading to a price decrease.
SMC Demand Chart Example [23:49]
In a demand zone example, a strong momentum candle indicates potential demand. A demand zone is drawn around the preceding candle, and after a period of sideways trading, the price drops to the demand area. Upon touching this zone, demand comes in, causing the price to rise sharply.
SMC Supply Chart Example [24:58]
In a supply zone example, a strong momentum candle indicates potential supply. A zone is drawn around the candle preceding the momentum candle. The price rises, touches the supply zone, and subsequently experiences a sharp downward movement, indicating that supply is entering the market.
High Quality Supply and Demand [26:37]
To find the best supply and demand zones, combine market structure analysis with supply and demand concepts. Market structure explains how and why the market moves, while supply and demand zones show imbalances in the market. Combining these concepts helps identify higher quality zones for trading.
High Quality Demand Zones [27:20]
High-quality demand zones are found at strong lows, which are created from moves that break structure. When a strong momentum candle appears at a strong low, a high-quality demand zone can be drawn. Traders look for the price to return to this demand area, anticipating demand to come in again, and often seek a candlestick pattern or price action signal to confirm the entry.
High Quality Supply Zones [29:11]
High-quality supply zones are found at strong highs, which are moves that break structure. If a move breaks the previous low, creating a change of character, a high-quality supply zone can be identified in that area. Traders wait for the price to potentially rise to the supply area and then reverse downward, often looking for a signal to justify a short position.
High Quality Supply and Demand Trading Strategy [30:52]
A trading strategy using high-quality demand involves waiting for a break of structure and identifying a strong momentum candle at a low. A demand area is drawn, and traders wait for the price to test this area. Upon testing the demand area, a bullish signal, such as a bullish hammer, is observed, signaling a potential entry point. Stop-loss orders are placed below the pattern or demand area, and target levels are set below the previous high.
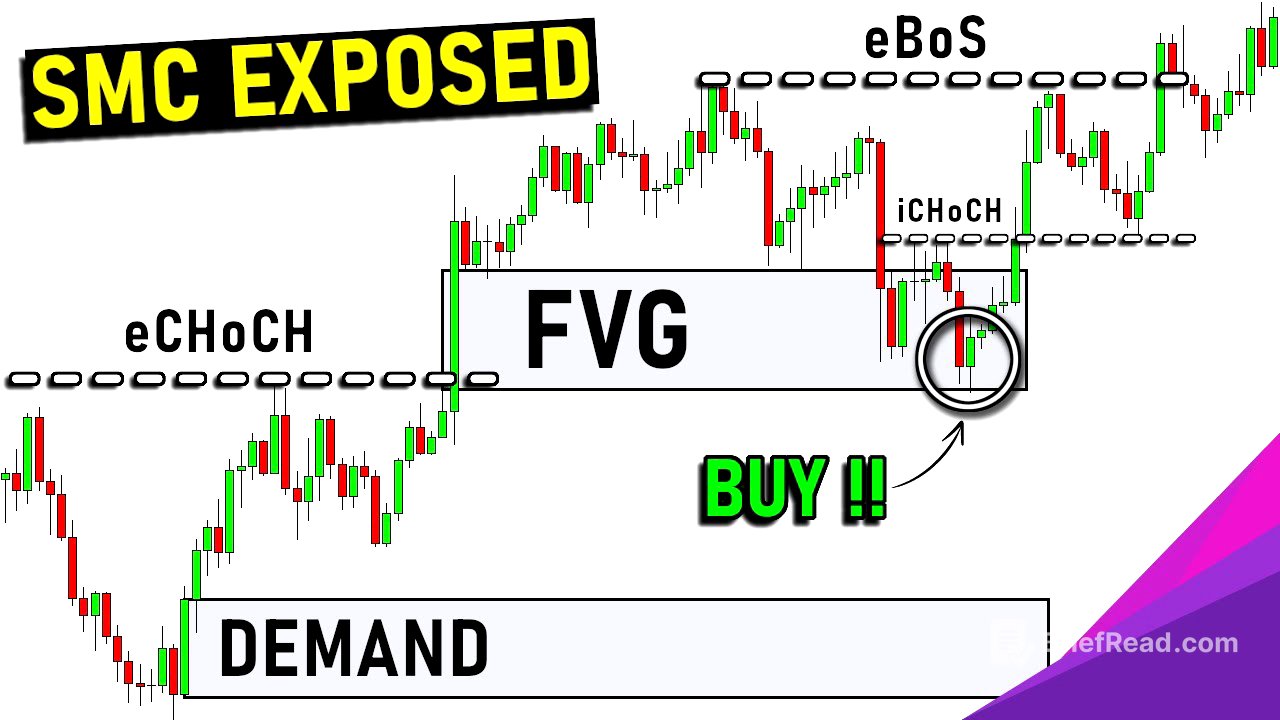
Fair Value Gaps (FVG) [35:09]
Fair value gaps (FVG) are similar to supply and demand areas, representing imbalances between supply and demand. These gaps occur due to large movements or momentum candles, creating temporary market inefficiencies. Traders use fair value gaps as potential entry points, expecting the market to fill these gaps.
How to Identify Fair Value Gaps (Correctly) [36:23]
To identify fair value gaps, look for a strong momentum candle. For a bullish fair value gap, identify the candles before and after the momentum candle. Draw a line from the highest point of the preceding candle to the lowest point of the candle that comes after; the distance between these points is the fair value gap. The opposite is true for bearish fair value gaps.
Fair Value Gap Entry Strategy [38:30]
Fair value gaps can be used to find entry points in the market, even in the middle of a move. For bullish fair value gaps, identify the gap in a move that breaks structure. After identifying the fair value gap, wait for the price to test this gap and look for a bullish signal to confirm a potential entry point.
How to Trade Fair Value Gaps [39:56]
To trade fair value gaps, identify a strong momentum candle and the gap between the highest and lowest points of the surrounding candles. After the price tests the fair value gap area, look for a clear signal, such as a bullish hammer, to enter. Place a stop-loss order just below the pattern and set a target either just below the break of structure or using a fixed risk-to-reward ratio.
Liquidity Grab [42:26]
A liquidity grab is a trading concept where large players, or smart money, push the price to trigger orders in areas with a high concentration of orders, known as liquidity zones. These zones often contain many stop-loss orders or buy orders waiting to be triggered. By triggering these orders, smart money creates liquidity for themselves, often leading to a market reversal.
Liquidity Grab or CHoCH or BoS? [44:38]
To differentiate a liquidity grab from a change of character (CHoCH), look for a candlestick that wicks below a support or resistance level and then quickly pushes back above. For a true change of character, the candle should close below the low point, confirming the change. Analyzing price action at critical market structure points is essential.
Liquidity Grab Trading Strategy [46:17]
To trade liquidity grabs, identify an uptrend where the price breaks a resistance level but then sees a sharp movement to the downside. This indicates a liquidity grab, where smart money may have triggered stop-loss orders above the high. Enter at the candle close of the candle that caused the liquidity grab, place the stop loss above the highest point of this candle, and use a risk-to-reward ratio to set the target level.
Do This Next! [47:59]
Viewers are encouraged to show support by liking the video and leaving comments with questions or suggestions for future video topics. They are also recommended to check out the playlist containing educational trading courses for further learning.