TLDR;
This video introduces the Rolling Zcore Trend indicator, a statistical tool for identifying overbought and oversold conditions with precision. It details how to set up the indicator on TradingView, adjust settings for different markets (Forex, Crypto, Gold, Stocks), and apply it in three powerful strategies: statistical mean reversion, momentum divergence detection, and trend strength qualification. The Zcore indicator uses statistical formulas to show price deviation from the mean, offering a scientific approach to trading.
- Introduces the Rolling Zcore Trend indicator for precise overbought/oversold detection.
- Explains setup, optimal settings, and three key applications.
- Provides specific settings for Forex, Crypto, Gold, and Stock markets.
Introduction to the Rolling Zcore Trend Indicator [0:00]
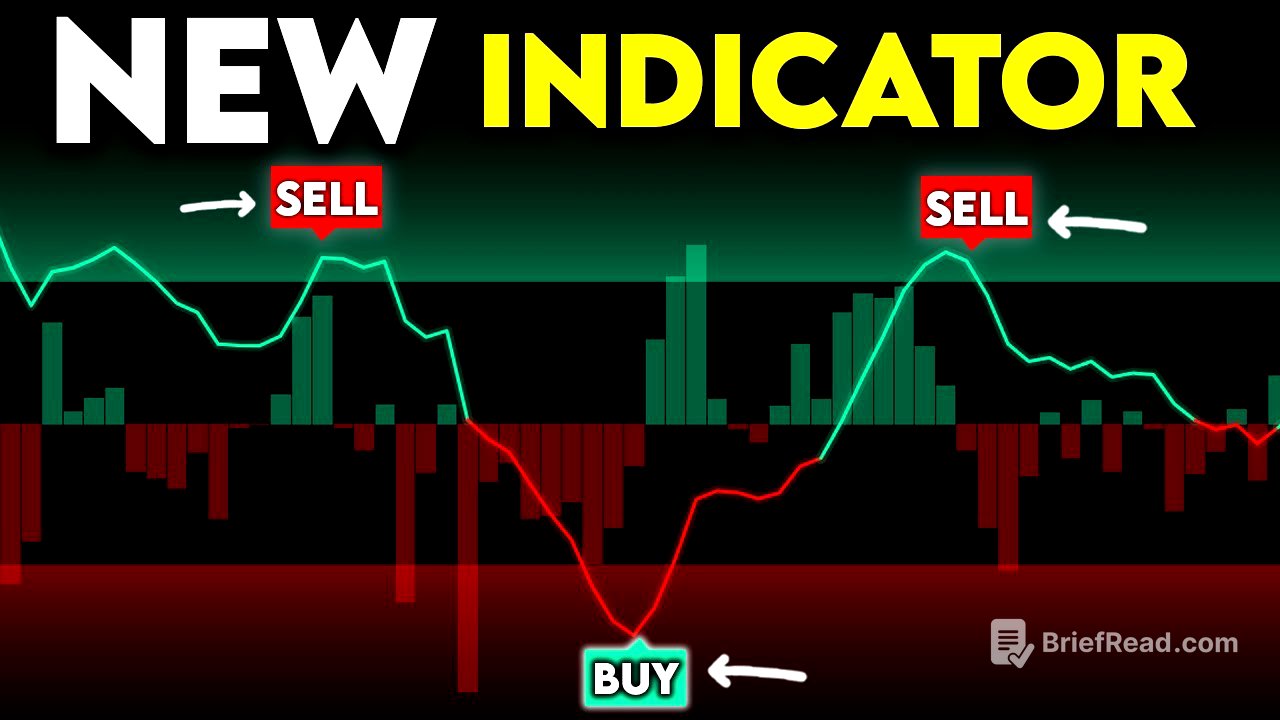
The video introduces the Rolling Zcore Trend indicator as a powerful tool for traders to identify overbought and oversold conditions with precision. Unlike other indicators that use arbitrary levels, the Zcore calculates how far the price has deviated from statistical norms, providing certainty about market extremes. The video promises to reveal the hidden indicator, show the best settings, and demonstrate three applications that can significantly improve trading strategies.
Setting Up the Rolling Zcore Trend Indicator [0:29]
To set up the indicator, navigate to TradingView and select any chart. The presenter uses the 4-hour timeframe on Euro Dollar as an example, noting that the indicator works on any market and timeframe. Add the "Rolling Zcore Trend" indicator by Quanalgo. The Zcore line shows price deviation from statistical norms, accompanied by background momentum columns indicating the rate of change in these deviations. A Zcore of +2.0 or higher signals significant overextension, while -2.0 or lower indicates oversold conditions.
Configuring the Indicator Settings [1:30]
To configure the settings, double-click on the indicator to open the settings panel. The look-back period, which determines the number of bars used to calculate the rolling mean and standard deviation, should be set to 50 for most timeframes. Enable the info table to display real-time Zcore values and set the EMA smoothing length to three to reduce noise while maintaining responsiveness. Under the style tab, enable the "show momentum columns" option.
Application 1: Statistical Mean Reversion [2:27]
The first application is for statistical mean reversion, where the Zcore's precision in determining reversal probability is highlighted. Wait for the Zcore to reach extreme territories, either above +2.0 or below -2.0. Before entering a trade, confirm with the momentum columns. Red columns above +2.0 signal decelerating deviation, ideal for short entries, while green columns below -2.0 indicate building bullish momentum from oversold conditions, suitable for long entries. Place stops at a 2.5 Zcore level or higher and target the zero line for the first take-profit.
Application 2: Momentum Divergence Detection [3:23]
The second application involves momentum divergence detection, using statistical analysis to spot divergences early. Monitor the Zcore line and momentum columns for conflicting signals. For example, if the price makes new highs but the Zcore shows lower peaks, it indicates statistical divergence and weakening momentum. The momentum columns will show weaker green readings despite higher prices, providing an early warning of trend exhaustion.
Application 3: Trend Strength Qualification [4:04]
The third application is for trend strength qualification, using the Zcore to assess trend strength rather than just identifying reversals. When the Zcore consistently stays above +1.0 with strong green momentum columns, it confirms a statistically strong uptrend. For enhanced validation, use multiple timeframes to identify statistical confluence. When both 1-hour and 4-hour Zcores show extreme readings in the same direction, it indicates a high probability setup.
Specific Settings for Different Markets [5:03]
For Forex pairs, set the look-back period to 60 for major pairs and EMA smoothing to three, using +/- 1.8 as extreme thresholds. For crypto, reduce the look-back period to 30 and increase the extreme thresholds to 2.5. For gold, use a look-back period of 40 with standard +/- 2.0 thresholds. For stocks like SPY and QQQ, set the look-back period to 50 with +/- 1.6 thresholds.


