TLDR;
This video explains the difference between statistics and parameters, using examples and symbols to illustrate the concepts. It highlights that statistics describe characteristics of a sample, while parameters describe characteristics of a population. The video also includes a quiz to test understanding of these concepts.
- Statistics describe a sample.
- Parameters describe a population.
- Key symbols differentiate sample and population characteristics.
Introduction to Statistics and Parameters [0:00]
Statistics are characteristics that describe a sample, which is a subset of a larger population. Parameters, on the other hand, are characteristics that describe the entire population. For example, if you want to estimate the average age of 100,000 residents in a town, taking the average age of 100 individuals would give you a sample mean (a statistic). The true average age of all 100,000 residents would be the population mean (a parameter).
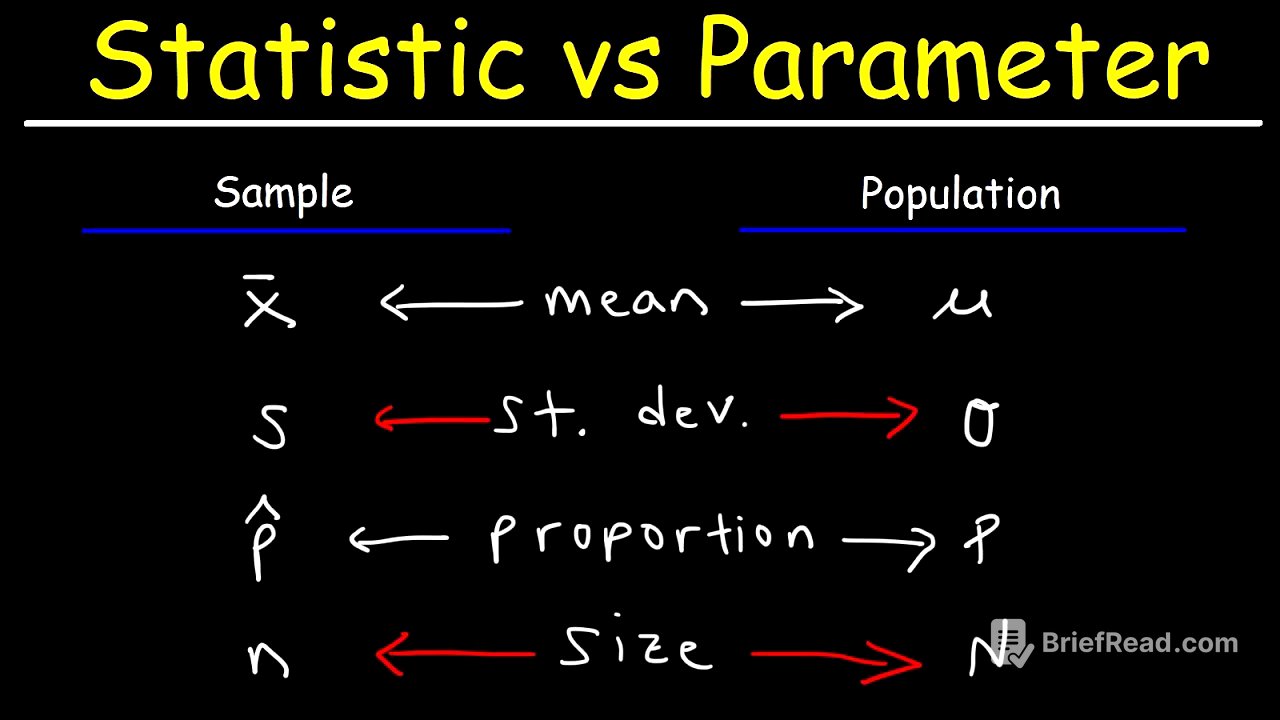
Variables and Symbols [2:15]
Different symbols represent statistics and parameters. The sample mean is represented by x̄, while the population mean is represented by μ (mu). The sample standard deviation is represented by s, and the population standard deviation is represented by σ (sigma). The sample variance is s², while the population variance is σ². The sample proportion is P̂ (P-hat), and the population proportion is P. The sample size is represented by lowercase n, and the population size is represented by uppercase N.
Quiz: Identifying Statistics and Parameters [4:04]
A quiz helps differentiate between statistics and parameters. The average weight of all males in the United States is a parameter because it describes the entire population. The average height of 100 cats in California is a statistic because it describes a sample. Similarly, the average test score of 20 students in a class of 500 is a statistic, while the average test score of all students in the class is a parameter.