TLDR;
This video serves as a comprehensive guide to understanding and trading market structure. It covers essential concepts such as identifying trends, understanding impulses and corrections, and avoiding common mistakes like misinterpreting internal structure and liquidity sweeps. The video also introduces a simple yet effective trading strategy using supply and demand zones, along with confirmation entries and the concept of sub-structure versus swing structure for enhanced trading opportunities.
- Understanding market structure is crucial for successful technical analysis.
- Trading with the trend increases profitability, while trading against it leads to losses.
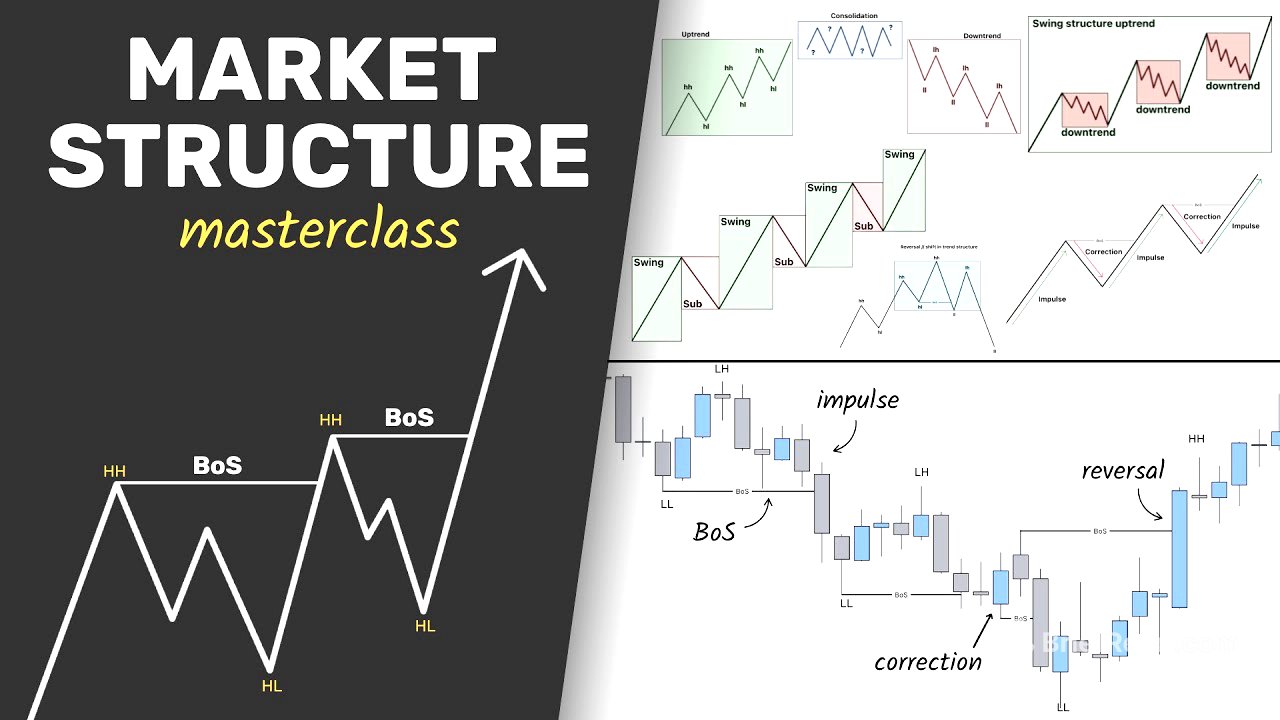
- Key concepts include uptrends, downtrends, consolidations, impulses, corrections, and breaks of structure (BoS).
- Common mistakes include misinterpreting internal structure and failing to differentiate between liquidity sweeps and actual breaks of structure.
- A simple trading strategy involves using supply and demand zones in conjunction with market structure analysis.
Why Market Structure Matters SO MUCH [0:00]
Mastering market structure is crucial for effective technical analysis. Trading with the trend leads to profitability, while opposing it results in losses. Market structure has been a core concept for profitable trading systems for years, but it's easy to misunderstand. This class aims to provide a comprehensive understanding of market structure to trade successfully and avoid common pitfalls like fighting the market or catching falling knives.
Trend Basics [0:30]
Markets move in three primary phases: uptrends, downtrends, and consolidations. Uptrends involve the market moving upwards, downtrends involve the market moving downwards, and consolidations involve the market moving sideways without significant upward or downward movement. The strategy involves buying during uptrends, selling during downtrends, and avoiding consolidations due to the lack of clear direction. The goal is to ride uptrends until signals indicate a potential shift downwards, at which point selling becomes the focus.
Highs & Lows [1:46]
Identifying market trends accurately involves focusing on highs and lows rather than relying on trend lines, which can be arbitrary and misleading. Higher highs and higher lows indicate an uptrend, where each high is higher than the previous one, and each low is higher than the previous one. Higher lows are crucial for maintaining the integrity of the uptrend, suggesting continued upward movement. The strategy involves buying around these higher low points to capitalise on larger upward moves.
Reversals Basics [4:00]
If the market pushes below a higher low, creating a lower low, it signals a break in the uptrend's integrity and potentially the start of a downtrend. Following a lower low, a lower high often forms, indicating a shift in trend direction. Instead of buying, the focus shifts to selling during pullbacks or retracements around the next lower high, anticipating further downward movement. This approach uses highs and lows to identify trend changes through simple price action analysis.
Structure Mapping (Highs & Lows) [5:28]
Analysing price action on a Euro Swiss Franc chart involves identifying trending direction using high and low structure. Initially, a high is identified, followed by a low, but the low doesn't break a previous higher low, indicating consolidation rather than a trend change. A subsequent push downwards creates a lower low, signalling the start of a downtrend. Lower highs and lower lows confirm the downtrend, with each high and low being lower than the previous ones.
Impulses vs Corrections [11:25]
Markets trade in two phases during a trend: impulses and corrections. Impulse moves are pro-trend, creating higher highs in uptrends or lower lows in downtrends, determining the trend direction. Corrective moves are pullbacks against the overall trend, occurring as the market temporarily slows down. Corrective moves are contained within the high and low of each impulsive move, not breaking above a high or below a low.
Impulse/Correction Example [17:38]
On a Euro Swiss Franc chart, impulses and corrections are marked to illustrate market movements. The initial uptrend shows green impulses creating new highs and red corrections pulling back without breaking significant lows. A shift occurs when a bearish impulse breaks a previous low, transitioning the market into a downtrend with red impulses and green corrections. This continues until another impulse pushes the market back into an uptrend, demonstrating the dynamic nature of market trends.
Break of Structure (BoS / ChoCh) [22:55]
A break of structure (BoS) is a tool used to identify when a trend has broken, occurring each time a new high or low is surpassed. When the market creates a new high, it signifies a break of structure at the previous high, indicating continued upward movement. Conversely, a bearish break of structure into a new low suggests a trend reversal. These breaks of structure help traders stay aligned with the trend, create confirmations, and formulate real trades.
BoS Mapping on Chart [25:59]
Analysing an Australia dollar Japanese yen chart, breaks of structure (BoS) are mapped to confirm trend directions. Initially, the market creates a lower low, but the trend doesn't change until the high is broken. A push to the upside creates the first BoS, indicating a potential uptrend. Subsequent pushes create new highs and corresponding BoS points, validating the uptrend. Closures above previous highs confirm bullish momentum, while wicks beneath levels indicate rejection of price action.
Internal Structure [33:19]
A common mistake in structure trading is misinterpreting internal structure, which occurs within impulsive moves. Internal structure refers to price action between the high and low of an impulse. Traders often mistakenly see breaks within this internal structure as trend changes, leading to incorrect trading decisions. It's crucial to focus on clear high-low structure to avoid this trap, ensuring that trading decisions align with the larger trend.
Liquidity Sweep vs BoS [38:55]
Another significant mistake is failing to differentiate between liquidity sweeps and actual breaks of structure. A liquidity sweep involves the market briefly pushing above or below a swing high or low to take out orders before reversing sharply. To distinguish between a true break of structure and a liquidity sweep, look for candle closures above or below structure. Closures indicate confirmation of the trend, while wicks suggest rejection and potential reversal.
Trading Structure with Supply & Demand [41:55]
The most straightforward way to trade with market structure is by using supply and demand zones. In an uptrend, a demand zone forms after a bearish corrective move bottoms out, indicating significant buying pressure. Conversely, in a downtrend, a supply zone indicates significant selling pressure. The strategy involves buying at demand zones during uptrends and selling at supply zones during downtrends, capitalising on institutional buying and selling.
Supply & Demand Trend Examples [45:43]
Analysing an NZDPY chart, the market is in a downtrend, creating lower lows and lower highs. Supply zones are identified as the last candle before an impulse with imbalance, where there's an open candle range. The strategy involves selling at these supply zones with stop losses above the highs, targeting the swing low. A losing trade occurs when the market breaks structure, shifting from a downtrend to an uptrend.
Confirmation Entries [54:11]
Confirmation entries provide an extra layer of validation for trades. In a downtrend, a short position can be taken at a supply zone, but some traders may prefer additional confirmation. A standard confirmation involves a price structure reversal on a smaller time frame, such as the 5-minute chart. This involves looking for a shift from higher highs and higher lows to a lower low, using a supply zone to sell the market after it returns to that level.
Sub Structure vs Swing Structure [59:08]
Substructure and swing structure involve analysing trends within trends. Swing structure refers to the clear directional bias on a higher time frame, while substructure refers to smaller trends within corrective moves on a lower time frame. For example, if the 4-hour chart shows an uptrend (swing structure), the 30-minute chart might show smaller downtrends within the corrective moves (substructure). This provides additional trading opportunities by selling during the corrective moves on the lower time frame.
Sub vs Swing Structure Example [1:01:30]
On a gold chart, the 4-hour timeframe shows a shift from bearish to bullish, indicating an uptrend. The swing structure suggests looking for buying opportunities during pullbacks to demand zones. However, on the 30-minute timeframe, traders can look for selling opportunities within the corrective moves, trading the substructure. This involves identifying a break in the 30-minute structure and selling towards previous areas of demand, creating a "sell to buy" scenario.
FREE TRADING COURSE [1:08:40]
If you enjoyed that video, hit the link in the description at the top. There is a free course which is going to help you to build a trading strategy. Second link goes to my academy if you really want to master this fast. And with that said, that is it for this class. So, thank you for watching. If you don't want to do either of those things, then watch this video next. Thank you. I'll see you in the next one.