TLDR;
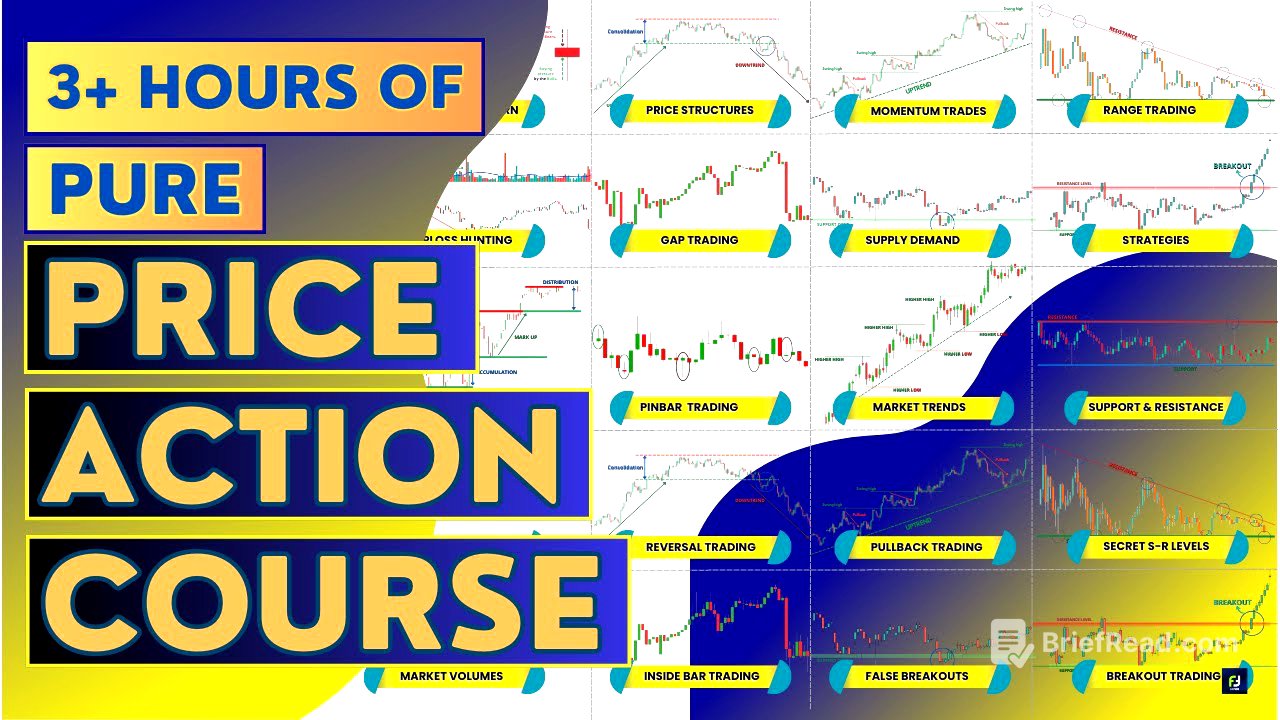
This YouTube video series by Fortune Talks provides a comprehensive guide to price action trading, covering essential concepts, strategies, and techniques for traders of all levels. The course aims to equip traders with the knowledge and skills to make informed decisions based on price behavior, market trends, and volume analysis.
- Introduces price action trading as an alternative to traditional technical analysis, focusing on price and volume.
- Explains market dynamics, including the roles of institutions and retailers, and the importance of following institutional footprints.
- Covers market phases (accumulation, uptrend, distribution, downtrend) and trend identification using trend lines and price swings.
- Discusses candlestick patterns, support and resistance levels, breakout and reversal strategies, and the significance of market volume.
Introduction to Price Action Trading [0:04]
The video introduces a free course on price action trading, designed for traders of all levels. The course covers basic to advanced concepts, drawing from trading books, paid courses, and online resources. The presenter aims to explain each concept in a way that is easy for even novice traders to understand.
Market Price Movements and Key Players [5:18]
The video explains how market prices move, emphasizing the role of supply and demand. It highlights that while news and events can influence prices, company earnings are the primary driver. The market is mainly controlled by institutions (mutual funds, banks, insurance companies, etc.), which account for most of the trading volume and dictate market direction. Individual traders should align with institutional trends to increase their chances of profitability. The video also discusses how market conditions change, transitioning between uptrends, downtrends, and consolidation phases (accumulation and distribution).
Market Trends: Identification and Analysis [16:15]
The video discusses market trends, defining a trend as the overall direction of the market over a specified period. It identifies three types of trends: uptrend, downtrend, and sideways trend. Trend lines are used to visualize price swings and identify the general market trend. The video emphasizes that trends are relative to the time frame used for analysis, and it explains how to draw trend lines to identify support and resistance areas. It also covers different types of sideways trends, including range contraction, range expansion, and triangular ranges.
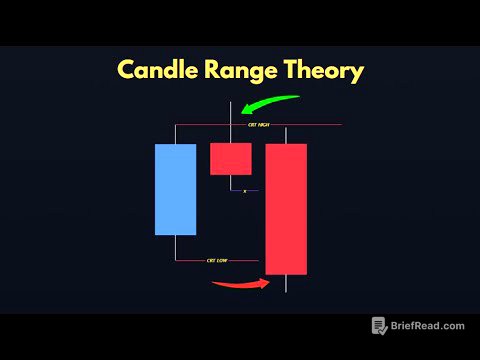
Candlestick Patterns: Reading Like a Pro [31:13]
The video explains how to read candlestick patterns without memorizing them. Candlesticks consist of a real body and shadows (wicks), representing the opening, high, low, and closing prices (OHLC). The color of the body indicates bullish (green/white) or bearish (red/black) price movement. The video discusses marubozu, pin bars (hammers, hanging man, shooting stars, inverted hammers), spinning tops, and dojis, explaining how to interpret their formations and implications for market sentiment. It also provides a ranking of candlestick patterns from strongest to weakest for both bullish and bearish scenarios.
Support and Resistance: Identifying Critical Price Levels [47:29]
The video focuses on support and resistance levels, defining them as price points that attract maximum buying or selling pressure. Support levels are below the current market price, while resistance levels are above. The video explains how institutions manipulate prices to build positions at fair prices, creating support and resistance levels. It outlines a four-step process for drawing support and resistance lines: loading data points and zooming out, identifying price action zones, aligning zones, and fitting a horizontal line. The video also discusses the importance of considering support and resistance as zones rather than single price points to account for approximation risk.
Advanced Support and Resistance Techniques [58:46]
The video discusses advanced techniques for trading with support and resistance levels. It explains how to identify when a support or resistance level is likely to break, emphasizing the importance of multiple tests within a short period. The video also provides tips for trading reversals, including looking for strong momentum moves into market structures and strong price rejections. It contrasts reversal trades with breakout trades, explaining when to anticipate breakouts based on patterns like ascending triangles, descending triangles, and price build-ups supported by moving averages.
Market Volume: A Leading Indicator [1:14:15]
The video discusses the importance of market volume as a leading indicator. Volume indicates the number of shares bought and sold over a given period. The video explains how to interpret volume in relation to price movements, noting that increasing volume with rising prices suggests institutional buying, while decreasing volume with rising prices suggests retail-driven bull traps. It also covers scenarios where price and volume decrease together, indicating a lack of institutional interest.
Breakout Trading Strategies: Techniques and Tips [1:32:24]
The video focuses on breakout trading strategies, discussing the pros and cons of breakout trades, including limited risk, momentum, and predefined entry/exit points, as well as false breakouts and opportunity costs. It advises against trading breakouts against the trend or when the price is far from market structures. The video presents two main breakout trading techniques: trend trading breakouts and trading near market structures, explaining how to identify high-probability breakout trades using patterns like ascending triangles, descending triangles, and price build-ups supported by moving averages.
Fakeouts: Identifying and Avoiding False Breakouts [1:52:49]
The video discusses how to identify and avoid false breakouts (fakeouts). It advises against chasing power moves into areas of value, as these often lead to reversals. The video presents several techniques for distinguishing between genuine breakouts and fakeouts, including analyzing volume, waiting for candlestick closes, looking for retracements and pullbacks, and using the Relative Strength Index (RSI) to confirm momentum.
Pullback Trading: Buying Low and Selling High [2:04:12]
The video focuses on pullback trading, defining a pullback as a temporary move against the underlying trend. It discusses the pros and cons of pullback trading, including buying low/selling high and easier trading psychology, as well as missing moves and the need for patience. The video outlines a step-by-step approach to pullback trading, including identifying the market trend, identifying areas of value, looking for entry triggers, and setting stop losses and targets. It also covers different pullback trading techniques, such as breakout pullbacks, horizontal steps, and using trend lines and moving averages.
Reversal Trading: Spotting Trend Changes [2:22:59]
The video focuses on reversal trading strategies, explaining how to identify potential trend changes. It advises against catching a falling knife or entering the first pullback, and it emphasizes the importance of having a reference point, waiting for the market to reach that point, and looking for reversal candlestick patterns. The video presents three techniques for identifying reversal trades: breaking the market structure, using higher time frame reversal structures, and using moving averages.
Inside Bar Pattern: A Simple Yet Powerful Tool [2:39:22]
The video explains the inside bar pattern, a candlestick pattern where the price forms completely within the previous candlestick. It discusses different types of inside bars, including small-range, large-range, multiple inside bars, and the hikake pattern (false breakout). The video presents three strategies for trading inside bars: inside bar breakout, inside bar reversal, and trend trading with inside bars.
Pin Bar Candlestick Pattern: Spotting Reversals [2:55:54]
The video provides a detailed study of the pin bar candlestick pattern, a popular reversal pattern. It explains the characteristics of a pin bar (large shadow/wick, small real body) and discusses how to identify high-quality pin bars in trending markets and at key market levels. The video presents strategies for trading pin bars with the trend and from areas of value, and it discusses common mistakes to avoid, such as expecting reversals based solely on pin bars and considering all pin bars to be equal.
Trading Gaps: Profiting from Price Discontinuities [3:09:36]
The video discusses trading gaps, which are areas of discontinuity in the chart where the price skips between two trading periods. It explains why gaps occur (supply/demand imbalance, overnight sentiment, institutional manipulation) and notes that gaps can act as support or resistance levels. The video covers different types of gaps (breakaway, runaway, exhaustion) and presents strategies for trading gaps based on breakouts and reversals, considering factors like volume, opening price, and pullbacks.