TLDR;
This video serves as an introductory guide on how to identify potential buyers in trading by understanding price movements between Points of Interest (POI) and liquidity. It emphasizes the importance of recognizing key POIs and liquidity levels on charts to predict price direction and improve trading profitability. The video explains how price action resembles a game between liquidity and POI, and how identifying the correct POI can lead to capturing significant price movements.
- Price moves between POI and liquidity in a continuous loop.
- Identifying correct POIs and liquidity levels is crucial for profitable trading.
- The concept of a "three candle swing" is introduced as a method to confirm POI validity.
Introduction [0:00]
The video introduces a simple method for traders to identify potential buyers, which is crucial for understanding market bias and improving trading outcomes. Knowing the bias allows traders to predict price movements and make profitable trades by entering in the direction of the bias. This knowledge also helps in minimizing stop-loss hits and maximizing profitable trades.
Price Movement: POI vs. Liquidity [1:02]
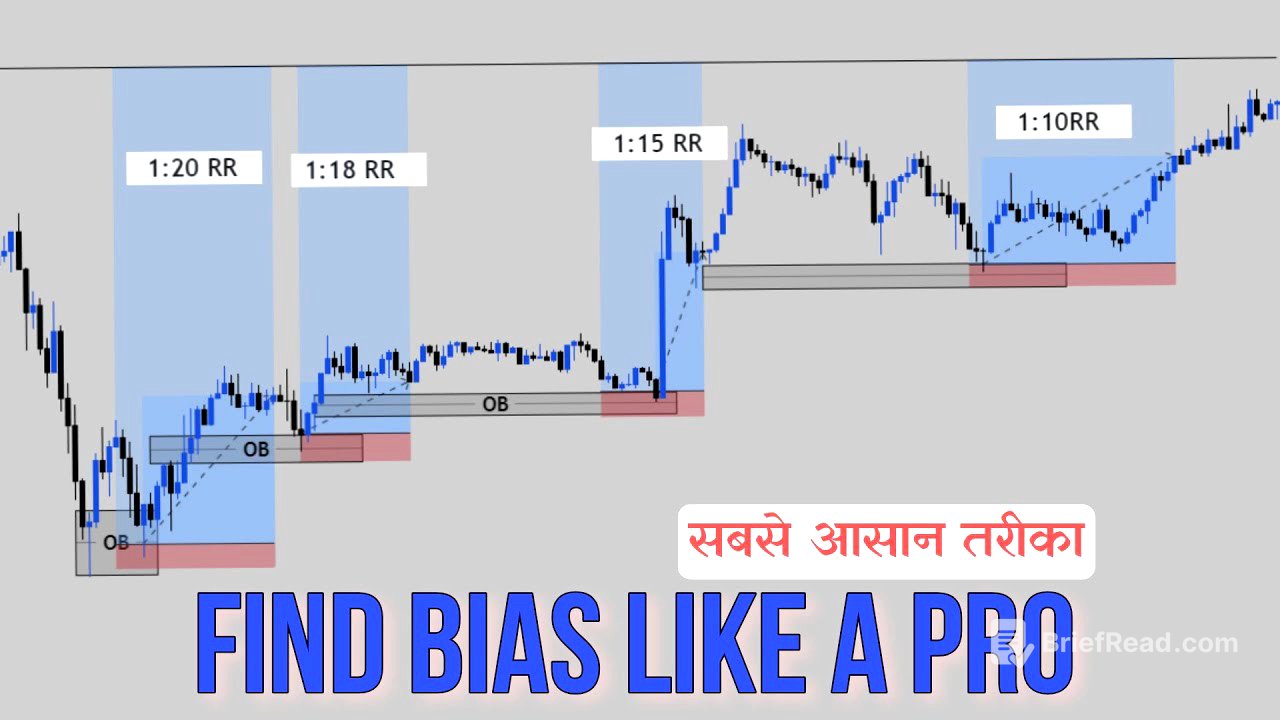
The price on a chart moves between two key elements: Point of Interest (POI) and liquidity, similar to a game of tag. When the price is at a POI, it seeks liquidity, and when it's at liquidity, it seeks a POI, creating a continuous loop. To trade effectively, one must identify the correct POI and enter trades to capture movements towards the right liquidity.
Understanding Levels and Forces [2:39]
Price moves between levels, which are essentially combinations of POIs and liquidity. These levels have the strength to push the price in different directions. When the price taps a level, that level's strength can reverse the price direction towards another level.
Important POIs [4:49]
Important Points of Interest (POIs) include order blocks, rejection blocks, reclaimed order blocks, mitigation blocks, and breaker blocks. Gaps, such as Fair Value Gaps (FVG) and imbalances, also act as POIs. The priority among these POIs is order blocks, followed by imbalances and then FVG.
Types of Liquidity [7:03]
Key types of liquidity include low resistance liquidity, high resistance liquidity, monthly/weekly/daily liquidity, and swing high/low liquidity. High resistance liquidity occurs where price movements encounter multiple levels like FVGs and order blocks, while low resistance liquidity happens when the price moves without significant obstacles. Monthly, weekly, and daily liquidity refers to the high and low of those period's candles, and swing liquidity is found at swing highs and lows.
Finding Buyers: Monthly Time Frame [10:31]
To find buyers, start by analyzing the monthly time frame to understand the overall direction. Mark all POIs and liquidity levels around the current price. By identifying these levels, traders can anticipate potential price movements.
Monthly Time Frame: Examples [11:12]
The presenter shares an example using a gold chart, marking order blocks and imbalances as POIs, and previous month highs and lows as liquidity levels. These levels are named for easy reference. The analysis helps determine potential price directions and movements, with the nearest levels being the most likely targets.
Three Candle Swing Concept [19:38]
When the price reaches a POI, it doesn't immediately reverse but forms a "three candle swing." The first candle taps the zone, the second shows displacement, and the third retests the POIs of the displacement candle before the fourth candle expands. This pattern confirms the validity of the POI.
Monthly Bias and Additional Tools [24:02]
For determining monthly bias, additional tools like the Ibb Ibb cycle and open float liquidity pool can be useful, especially when shifts in price direction are anticipated over a longer term (5-6 months). These tools are not always necessary but become important during specific market conditions.
Finding Buyers: Weekly Time Frame [25:47]
The process of finding buyers on the weekly time frame mirrors that of the monthly, involving identifying POIs and liquidity levels. The presenter demonstrates this using a gold chart, marking order blocks and FVG as POIs, and recent highs and lows as liquidity. The three candle swing concept is then applied to validate potential price movements.
Weekly Time Frame: Example [26:15]
The presenter walks through an example on the weekly chart, emphasizing the importance of the three candle swing concept. After a level is tapped, displacement and retest should occur before expansion. Levels that do not show these reactions are deemed less relevant.
IDM and POI Tapping [32:40]
After an inducement (IDM) pattern, there's a high probability that the price will tap the first POI and then move away. In such cases, the price often runs away from the FVG.
Finding Buyers: Daily Time Frame [35:47]
The method for identifying buyers on the daily time frame is consistent with the monthly and weekly analyses. The presenter illustrates this with examples, marking order blocks and liquidity levels, and using the three candle swing to confirm potential price movements.
Daily Time Frame: Examples [36:06]
The presenter provides examples on the daily time frame, highlighting how the three candle swing helps confirm whether an order block will be respected. The analysis also considers the overall direction indicated by the weekly and monthly biases.
Combining Time Frames and Lower Time Frame Execution [44:10]
Buyers should be identified on the monthly, weekly, and daily time frames, while trade execution should occur on lower time frames like 4 hours, 1 hour, 30 minutes, or 15 minutes. The presenter demonstrates how to make an entry on a lower time frame after identifying the bias on higher time frames.
Entry on Lower Time Frame [44:49]
To enter a trade on a lower time frame, wait for a candle to tap a POI, then wait for the next candle to show displacement. The last POI of the displacement candle should be retested before entering the trade, with the take profit set at the nearest liquidity.
Dealing Range [46:21]
The dealing range tool can be used when the trader is uncertain about their position in the market. By marking the low and high of a leg and identifying the 0.6 and 0.7 levels, traders can anticipate potential price movements.
Final Thoughts [47:41]
The video concludes by reiterating the importance of identifying buyers on higher time frames and executing trades on lower time frames. The presenter also touches on specific order blocks and encourages viewers to request further explanations in the comments.