TLDR;
This video explains the concept of confidence intervals, differentiating between point estimates and interval estimates. It details how to construct confidence intervals, particularly focusing on 95% and 99% confidence levels, and includes practical examples for single population means and proportions. The video emphasizes the importance of understanding the range within which a population parameter is expected to lie, along with the degree of confidence associated with that range.
- Point estimate is a single value to estimate population parameter.
- Interval estimate provides a range of values, accompanied by a confidence level.
- Confidence intervals are constructed using a point estimate and a margin of error.
Introduction [0:00]
The video introduces the concept of confidence intervals and promises to explain how to construct 95% and 99% confidence intervals using examples. It sets the stage for understanding estimates and their types before diving into confidence intervals.
Estimates ( Point Estimates & Interval Estimates) [0:28]
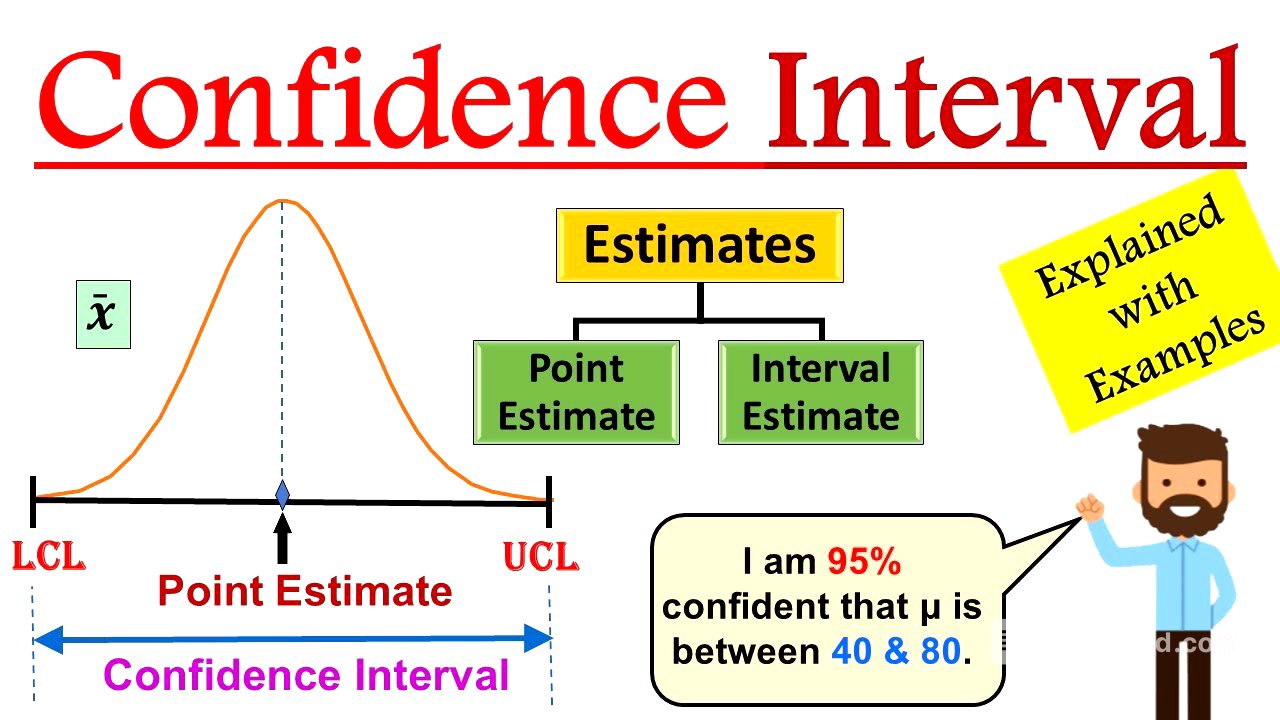
The video explains the concept of estimation, relating it to everyday scenarios like estimating the speed of a car when crossing the road. It then transitions to statistical estimates, highlighting two types: point estimates and interval estimates. A point estimate is a single value used to estimate a population parameter, illustrated by an example of calculating the average weight of a sample of four people to estimate the population mean. The video notes the limitations of point estimates, as they can be inaccurate due to sampling errors, and introduces interval estimates as a range of values within which a population parameter is expected to lie, defined by an upper confidence limit (UCL) and a lower confidence limit (LCL).
Confidence Intervals [3:38]
Confidence intervals, a common type of interval estimate, are composed of a point estimate and a margin of error. The margin of error indicates the error by the extent of its range and the probability of the true population parameter lying within that range. A 95% confidence interval means one can be 95% confident that the true mean of the population lies within the specified range. The correct interpretation of a 95% confidence interval is that "We are 95% confident that the population parameter is between a certain range".
Example 1 : Confidence Intervals for Single population Mean [4:53]
The video transitions to providing practical examples, starting with how to calculate confidence intervals for a single population mean.
Example 2 : Confidence Intervals for Single population Proportion [6:28]
The video provides a second example focused on calculating confidence intervals for a single population proportion. In the given example, it is stated that there is a 99% confidence that the true proportion of billing statements containing errors lies between 7.7% and 12.7%.