TLDR;
This video explains candlestick charts, their components, and how to interpret various candlestick patterns to identify potential buy and sell signals. It emphasizes the importance of understanding market sentiment through candlestick analysis and provides insights into specific trading strategies.
- Candlesticks communicate market sentiment by reflecting price action during a specific period.
- Key candlestick patterns include long body candles, hammers, hanging men, shooting stars, and dojis, each signaling different market conditions.
- Candlestick patterns are most effective when used in trending markets to identify potential reversals or corrections.
Intro [0:00]
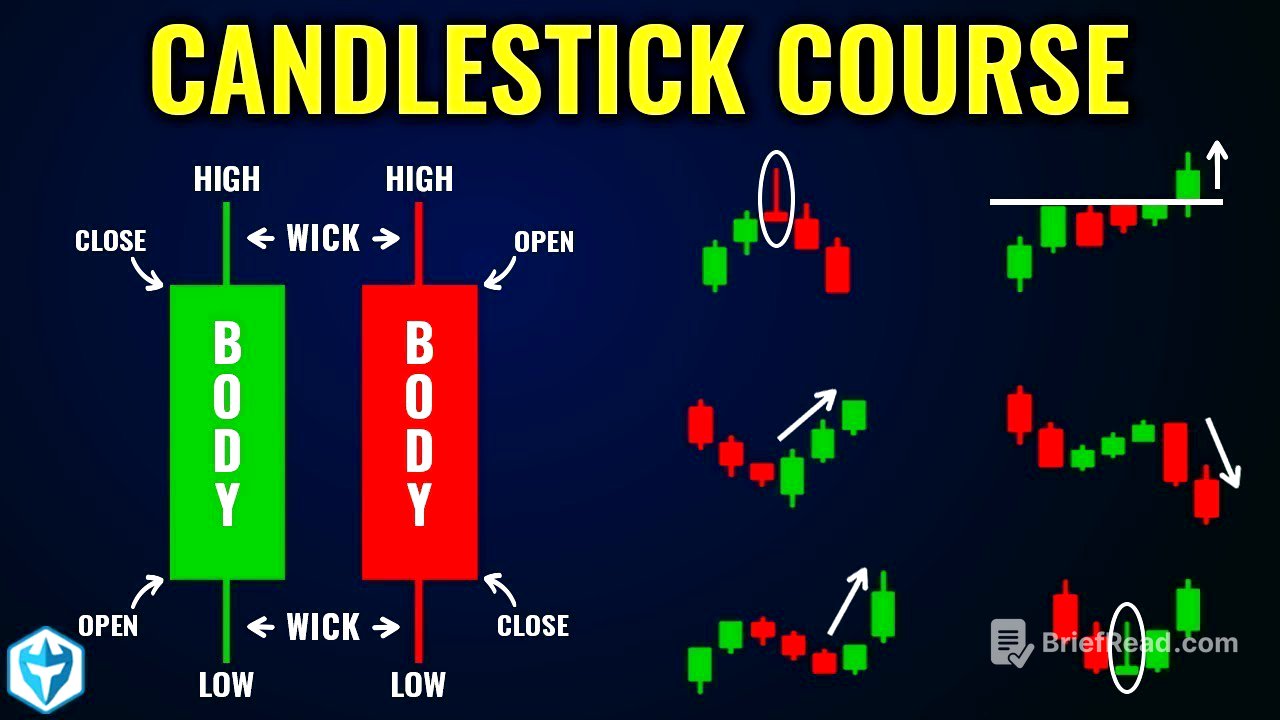
The video introduces candlestick charts as a tool for traders to understand market sentiment. Candlesticks, originating in 18th-century Japan, communicate four key pieces of information: the open, close, high, and low prices. The shape of a candlestick reflects the battle between buyers and sellers during a trading period, indicating who was in control. While daily charts provide a big-picture context, active day traders often use shorter time frames like one-minute charts to find precise entry points. Green candles indicate that the close price was higher than the open, while red candles indicate the opposite.
What The Different Candlestick Shapes Mean [4:42]
Candlestick shapes communicate market sentiment through their wicks (or shadows) and bodies. A bullish candle has a long body, indicating that buyers pushed the price up. A larger upper candle wick shows selling pressure, while a lower candle wick indicates buying pressure. Ideally, a strong bullish candle has no upper wick, closing at the high. Upper candle wicks are bearish, while lower candle wicks are bullish.
Long Body Candles [7:44]
Long body candles, whether red or green, signify strong market emotion and volatility. The body of a candle represents the range between the open and close prices, while the wicks indicate the high and low prices. Larger candles generally communicate more significant sentiment. Active traders often seek volatility, which stems from market emotions reflected in these candles.
Hammer Candlestick [10:10]
A hammer candlestick has a long lower wick and a small body, signaling potential bullish reversal. It forms when the price declines but buyers push it back up, indicating strength. In a downtrend, a hammer suggests the base is being "hammered out," potentially reversing the trend. Confirmation of the hammer's signal comes when the next candle is green and moves higher, presenting a buy signal.
Candle Over Candle Pattern [14:04]
The candle over candle pattern is a two-candle formation where a green candle breaks above the high of the previous red candle, signaling a buy. The first candle is the trigger, and the second confirms the new high. This pattern, combined with a hammer, can provide a strong buy signal, often missed by beginner traders.
Doji Candle [16:25]
A doji candle opens and closes at roughly the same price, indicating market indecision. Variations include the gravestone doji (long upper shadow), dragonfly doji (long lower shadow), and long-legged doji (long range). All doji candles suggest a battle between buyers and sellers with no clear winner, often signaling potential reversals or corrections, especially after a significant rally.
Reversal/ Correction Candlesticks [17:35]
Dojis appearing at the top of a rally can warn of a potential reversal or correction. Traders should consider locking in profits or reducing their position size. Candlestick charts often show price movements in waves, allowing traders to hold a portion of their position during corrections. Recognizing topping and bottoming tails helps identify potential reversal points.
Buy and Sell Signals on Candlestick Charts [20:03]
Learning to recognize candlestick shapes and interpret their signals is crucial for identifying buy and sell opportunities. Consistent practice is essential to convert this knowledge into a profitable skill.
Shooting Star Candle [21:38]
A shooting star candle, similar to a gravestone doji but with a slightly larger body, indicates a potential price reversal at the top of an uptrend. Confirmation requires a candle under candle pattern, where the next candle breaks the low of the shooting star. This signals the beginning of a short-term correction.
Support/ Resistance [23:36]
Candlestick patterns help define areas of support and resistance. Bottoming tails indicate support (demand), while topping tails indicate resistance (supply). A common trade involves buying when a green candle crosses the high of a red candle (candle over candle pattern) near a support level, with a stop-loss order placed below the support.
Dojis, hammers, shooting stars, and hanging men are only important during strong trending up or down.
How Candlesticks Communicate Market Sentiment [31:40]
Candlesticks communicate market sentiment, but their effectiveness depends on the traded instrument. It's more effective to trade instruments with high visibility and volume, such as stocks with breaking news, as these attract more traders and create cleaner price action.
One of Ross's Favorite Patterns [35:45]
One of Ross's favorite patterns begins with a news catalyst that causes an immediate price surge, forming long body candles. He waits for a correction, indicated by dojis, shooting stars, or hanging men, before considering an entry. Depending on the correction candle, he uses different strategies to confirm the reversal and enter a long position, targeting a 2:1 profit-to-loss ratio.
Bull Flag and ABCD Pattern [47:28]
The bull flag pattern involves a few candles going up, followed by a couple pulling back, and then the first candle making a new high. The ABCD pattern is similar, but the price fails to reach new highs on the first attempt, creating an ABCD formation. The more times a resistance level is tested, the more likely it is to break. Moving average pullbacks can also provide support levels for potential breakouts.
Outro [51:47]
The video concludes by encouraging viewers to download a 112-page PDF resource on technical analysis and practice trading strategies in a simulated environment before using real money. It emphasizes the importance of pattern recognition and building confidence through practice.