TLDR;
This video provides a comprehensive guide on how to trade chart patterns effectively in both crypto and stock markets. It covers various patterns, including double tops and bottoms, triple tops and bottoms, trend continuation and change patterns, head and shoulders, and triangles, channels, and wedges. The video explains the anatomy of each pattern, how to identify them, and strategies for trading them, including variations for entry and stop-loss placement.
- Double Top and Bottom Patterns
- Triple Top and Bottom Patterns
- Trend Continuation and Change Patterns
- Head and Shoulders and Inverse Head and Shoulders Patterns
- Triangles, Channels, and Wedges
Introduction to Chart Pattern Trading [0:17]
The video introduces chart pattern trading as a strategy applicable to both crypto and stock markets. It mentions a detailed, over 100-page pattern trading guide that complements the video content, offering viewers a cheat code to enhance their trading skills. The presenter encourages viewers to like, subscribe, and turn on notifications for more content.
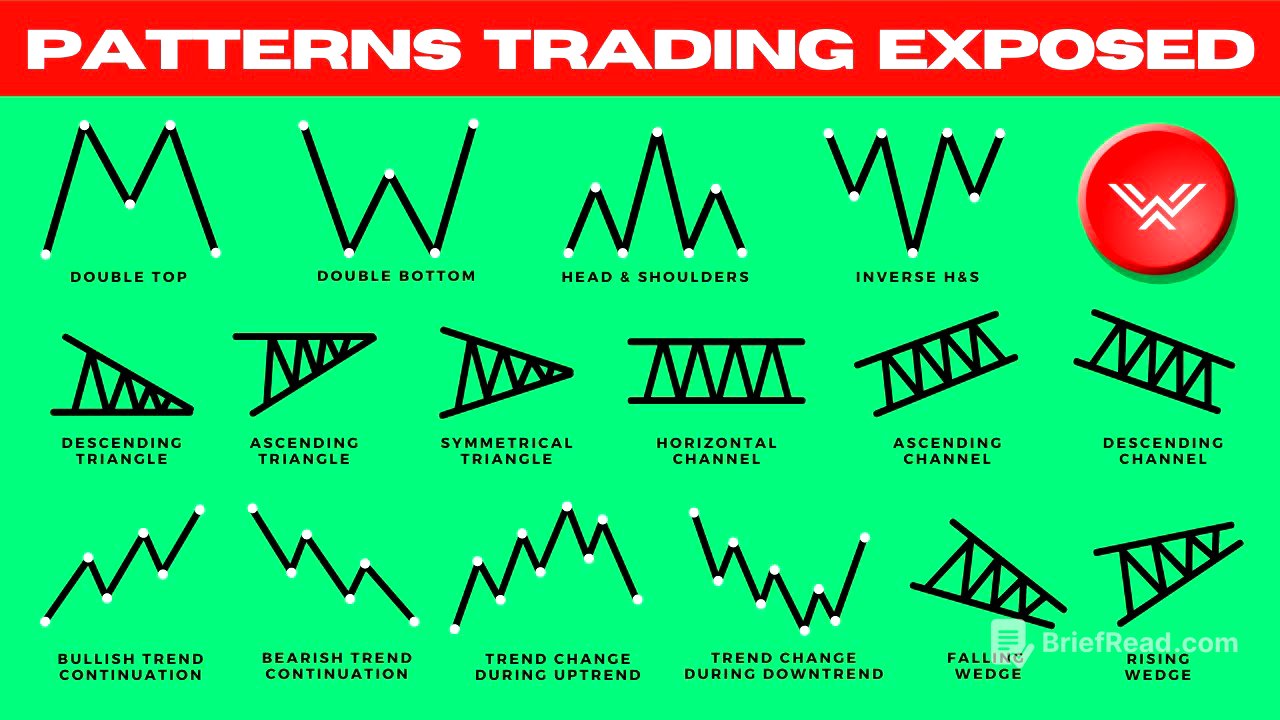
Double Top and Double Bottom Patterns: Anatomy and Identification [1:14]
This chapter explains the anatomy of double top and double bottom patterns. A double top forms in an uptrend when the price makes two highs at the same level, indicating a potential loss of momentum from buyers. The swing low between the two tops is called the neckline. Conversely, a double bottom forms in a downtrend when the price makes two lows at the same level, suggesting a loss of momentum from sellers. The swing high between the two bottoms forms the neckline.
Trading Strategies for Double Top and Double Bottom Patterns [2:30]
This section outlines four core variations for trading double top and double bottom patterns. The first strategy involves a neckline break entry, where a trader enters a short position after the price breaks below the neckline in a double top pattern, or a long position after the price breaks above the neckline in a double bottom pattern. The second variation involves identifying these patterns at key support and resistance levels, increasing the quality of the trade due to confluence. The third variation suggests waiting for a pullback entry after the neckline break. The fourth variation involves identifying candlestick patterns forming at a key level, followed by a double top or double bottom pattern inside those candlesticks on lower time frames.
Triple Top and Triple Bottom Patterns [9:09]
The triple top pattern occurs when price in an uptrend makes three attempts to break a level but fails, forming three same highs, while the triple bottom pattern occurs when price in a downtrend makes three attempts to break a level but fails, forming three same lows. The swing lows in triple top create neckline and support level, while swing highs in triple bottom create neckline and resistance level. The strategies for trading triple top and triple bottom patterns mirror the four variations discussed for double top and double bottom patterns.
Trend Continuation Patterns: Bullish and Bearish [10:39]
This section describes trend continuation patterns, distinguishing between bullish and bearish scenarios. A bullish trend continuation pattern is characterized by higher highs and higher lows, indicating sustained bullish momentum. Conversely, a bearish trend continuation pattern features lower highs and lower lows, signaling continued bearish momentum.
Trend Change Patterns: Identifying Reversals [12:06]
This section explains trend change patterns in both bullish and bearish markets. In a bullish market, a trend change pattern occurs when the price makes a lower low or both a lower high and a lower low, indicating a potential reversal. In a bearish market, a trend change pattern forms when the price makes a higher high or both a higher low and a higher high, signaling a possible reversal from a downtrend to an uptrend.
Head and Shoulders and Inverse Head and Shoulders Patterns [14:03]
The head and shoulders pattern starts with an uptrend, forming a left shoulder, a head (higher high), and a right shoulder (lower high). The swing lows create a neckline or support level, indicating a potential trend change. A higher quality pattern includes a slanted neckline, where a lower low has already formed. The inverse head and shoulders pattern occurs in a downtrend, forming a left shoulder, a head (lower low), and a right shoulder (higher low), with swing highs creating a neckline or resistance level. A higher quality inverse pattern includes a slanted neckline, with a higher high already formed.
Trading Strategies for Head and Shoulders Patterns [16:23]
This part details three core variations for trading head and shoulders patterns. The first is the neckline break entry, where a trader enters a short position after the price breaks below the neckline in a head and shoulders pattern, or a long position after the price breaks above the neckline in an inverse head and shoulders pattern. The second variation involves waiting for a pullback entry after the neckline break. The third variation is an aggressive early entry at the right shoulder of the pattern, using candlestick patterns on lower time frames to confirm the completion of the right shoulder.
Triangles, Channels, and Wedges: Core Patterns [20:15]
This section introduces triangles, channels, and wedges as a set of patterns, explaining their variations and how they are used in trading strategies. The triangle pattern includes ascending, descending, and symmetrical triangles. The channel pattern includes ascending, descending, and horizontal channels. The wedge pattern includes rising and falling wedges. The presenter emphasizes that when drawing lines to identify these patterns, traders should treat them as approximations and areas rather than expecting perfect formations.
Trading Strategies for Triangles, Channels, and Wedges [27:18]
The foundation of using triangles, channels, and wedges is trading in the direction of where the pattern breaks. The section details several strategy variations, including identifying a trend followed by a pattern formation and then a pattern break in the main trend direction (trend continuation), or a pattern break in the opposite direction of the main trend (reversal). Additional strategies involve waiting for a pullback entry after the breakout, identifying a pattern forming at a key level, and identifying a key level followed by a candlestick formation and then a pattern inside. The importance of precision stop-loss placement is emphasized, with different placements required for breakout and pullback entries.