TLDR;
This video explains a trading strategy that combines Fibonacci retracement levels with price action analysis to identify high-probability trade opportunities. It emphasizes the importance of understanding trade quality by considering multiple factors and traits that increase the likelihood of a trade's success. The video also covers how to use multi-time frame analysis to confirm trend changes and improve trade entries.
- Fibonacci levels can act as support and resistance levels.
- Combining Fibonacci levels with key levels of support and resistance or areas of confluence increases trade quality.
- Trade quality is influenced by factors like trend trading, breakout momentum, fresh trends, higher time frame usage, time frame confluence, divergence, trend lines, moving averages, candlestick patterns, and chart patterns.
Introduction [0:14]
The video introduces a trading strategy that combines Fibonacci with price action, applicable to various asset classes like stocks, options, cryptos, and currencies. It promises to cover concepts not commonly found online and references a successful Bitcoin trade using the strategy.
Understanding Fibonacci [1:43]
The Fibonacci tool is important because it provides trade entry opportunities at areas of value during a moving trend, acting as key support and resistance levels. To access the Fibonacci retracement tool, find and select "Fib Retracement" in your trading platform's toolbar. Apply it by clicking on a chart, dragging to the desired point, and clicking again to display Fibonacci levels. These levels are widely used by traders and represent areas of value within a trend.
Applying the Fibonacci Tool [3:21]
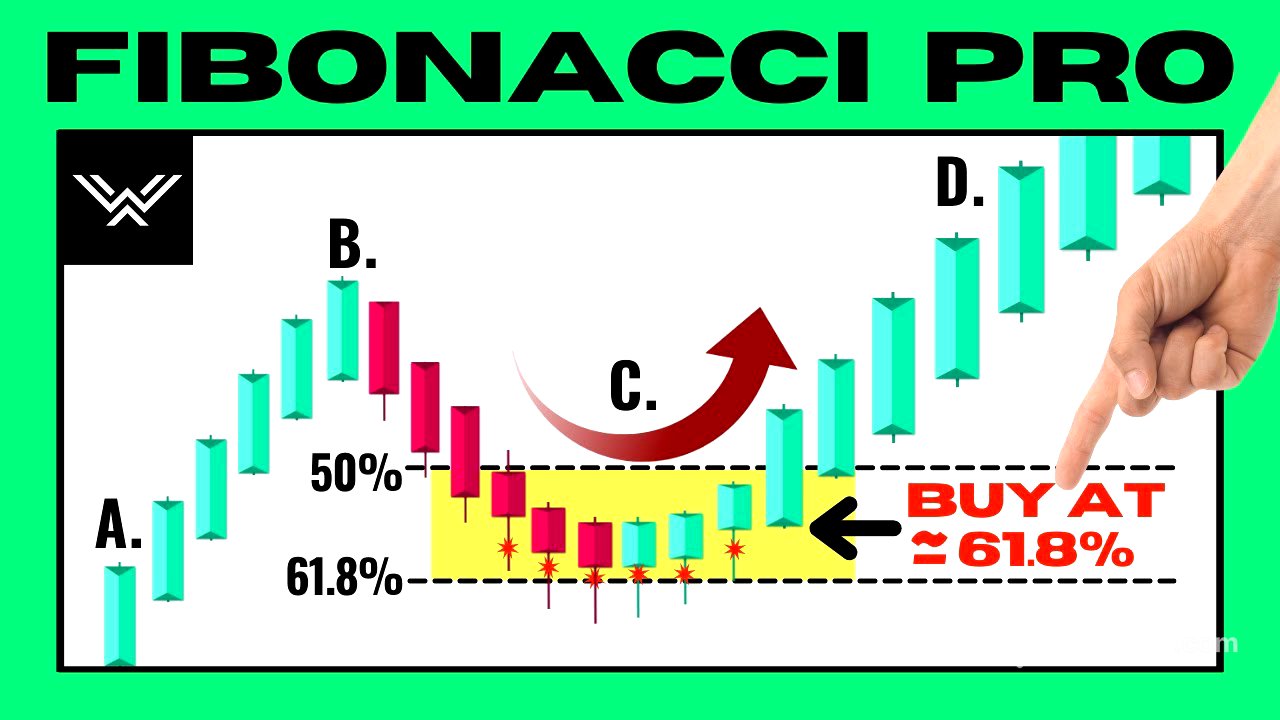
To apply the Fibonacci tool in an uptrend, click on the swing low and drag to the swing high to identify potential long entry points. In a downtrend, click on the swing high and drag to the swing low to find potential short entry points. The 50% and 61.8% levels represent pullback percentages from the recent swing high or low.
Traditional Use and Psychology of Fibonacci [5:21]
Average traders enter long trades at Fibonacci retracement levels in an uptrend, expecting support, and short trades in a downtrend, expecting resistance. Fibonacci levels work due to herd mentality, acting as a self-fulfilling prophecy, and because they represent areas of value, offering better prices relative to the recent price movement.
Using Fibonacci in Trading [7:34]
The presenter uses the 50% and 61.8% Fibonacci levels, considering them high-quality areas for potential reversals. The 61.8% level is considered the best due to representing a very deep pullback. The problem with using Fibonacci levels the traditional way is that traders often enter trades instantly when price hits a Fibonacci level, assuming a reversal without considering other market factors.
Combining Fibonacci with Support and Resistance [9:46]
The presenter combines Fibonacci levels with key support and resistance levels to increase trade quality. Key levels of support and resistance are levels where price has reacted in the past. Combining a key support level with a key Fibonacci level increases the quality of a trade opportunity. Traders should wait for price action, such as candlestick formations, to confirm a reaction to the level before entering a trade.
Combining Fibonacci with Confluence [12:26]
Areas of confluence are where multiple schools of traders are looking to take action, presenting higher probability trade opportunities. An example is given where a short trade opportunity occurs at an area of confluence with a downtrend, key resistance level, trend line, and moving average. Fibonacci retracement is used to increase the quality of the trade.
Understanding Trade Quality [15:03]
Trade quality refers to the attributes and factors that influence the chances of success of a trade opportunity. Trading should be viewed as taking low-quality versus high-quality trades. The more one learns about price action, the more high-quality trades can be identified.
High Quality Trade Traits [18:29]
A list of high-quality traits is presented, including trend trading, breakout momentum, fresh trend versus trend exhaustion, using higher time frames, multi-time frame usage and time frame confluence, divergence, Fibonacci retracement levels, trend lines, moving averages, areas of confluence, candlestick patterns, and chart patterns. Support and resistance quality traits are also important, such as levels found on higher time frames, extreme swing highs or lows, multiple reactions, and recently formed levels.
Trading Strategies: Combining Fibonacci with Support and Resistance [25:32]
The core strategy is a trend-trading strategy that combines Fibonacci with key levels of support and resistance using one time frame. The presenter identifies high-quality traits in a trade opportunity, such as a key level with multiple reactions and heavy bullish momentum. The Fibonacci tool is used to confirm the trade opportunity.
Trading Strategies: Combining Fibonacci with Confluence (Part 1) [28:04]
The presenter explains what should be going through your mind at every step of the trade. First, identify the uptrend, key level of resistance turned to support, and heavy bullish momentum. Then, identify the moving average and trend line that cross perfectly with the key level. Check to see if you are at a Fibonacci level as well.
Trading Strategies: Combining Fibonacci with Confluence (Part 2) [31:00]
Even after identifying high-quality traits, you need to wait for price action through candlesticks forming at the area of confluence to show that price is indeed reacting to the area. You then need the trend change confirmation pattern and the key entry and exit strategy and entry tool.
Trend Change Confirmation Pattern [34:58]
A trend change confirmation pattern is needed because the big picture trend may be an uptrend, but the immediate trend is a downtrend. To get around this problem, you need the short-term downtrend to turn from bearish to bullish. This can be done by placing a trend line onto the immediate trend and waiting for a trendline break.
Multi-Time Frame Usage [39:03]
If you cannot place a trendline onto the immediate trend, you need to use multi-time frames. Use a lower time frame where you can look inside of the downtrend and be able to see the swings and price movement of this trend. Look for price action that shows a trend change from a downtrend to an uptrend to confirm that the downtrend is over and that the larger uptrend can continue.
Bitcoin and Crypto Trade Example (Part 1) [44:07]
The presenter breaks down a massive Bitcoin trade using everything shown in the video and some more advanced concepts. The monthly time frame is used as guidance for trade entries taken on the lower time frames. Three high-quality traits gave a clear bullish directional bias: a key monthly resistance level turned to support, price breaking through this key level, and price being in a clear downtrend before making a higher high.
Bitcoin and Crypto Trade Example (Part 2) [47:23]
The presenter goes through the high-quality traits on the weekly time frame, including a key weekly level, bullish momentum, a clear moving uptrend, and a moving average that crossed perfectly with the key level. The Fibonacci tool is used to confirm the trade opportunity. A lower time frame (daily) is used to look inside of the pullback where the swing highs and lows of price can be seen.
Bitcoin and Crypto Trade Example (Part 3) [51:32]
After the trend change confirmation breakout, the final step is to go to the lower intraday time frames and use the key entry and exit strategy and entry tool. The presenter concludes by encouraging viewers to leave comments with topics they want to be covered next and promoting their Instagram page and trading art.