
TLDR;
This video focuses on the one-sample t-test, explaining when and how to use it in hypothesis testing. Key points include the difference between Z tests and t-tests, defining null and alternative hypotheses, calculating degrees of freedom, setting a decision rule, calculating the test statistic, and interpreting results.
- One-sample t-tests are used when the population standard deviation is unknown.
- The process involves seven steps: defining hypotheses, stating alpha, calculating degrees of freedom, establishing a decision rule, calculating the test statistic, stating results, and drawing conclusions.
One-Sample T-Test Overview [0:00]
The video begins by contrasting Z tests with t-tests. Z tests are applicable when the population standard deviation is known, while t-tests are used when the population standard deviation is unknown, requiring an estimate and utilizing the T distribution.
Example Scenario [0:30]
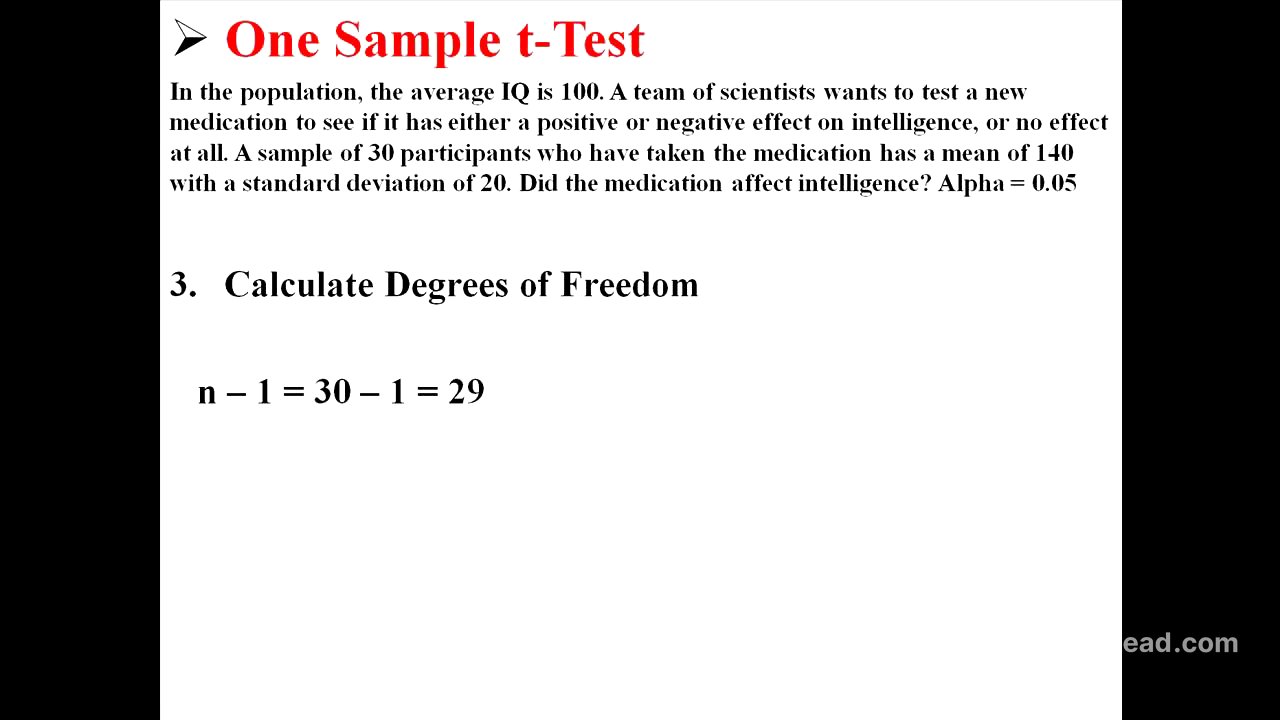
An example is presented where a scientist investigates the effect of a medication on intelligence. The population mean IQ is known to be 100, and a sample of 30 participants who took the medication had a mean of 140 and a standard deviation of 20. The goal is to determine if this medication significantly affects intelligence with an alpha level of 0.05.
Defining Hypotheses and Alpha Level [1:11]
The null hypothesis (H0) is defined as the mean IQ being equal to 100, while the alternative hypothesis (H1) states that the mean IQ is not equal to 100. The chosen alpha level for the test is set at 0.05.
Calculating Degrees of Freedom [1:53]
To compute degrees of freedom for the t-test, the formula n - 1 is used, leading to 29 degrees of freedom for the sample of 30 participants. This factor is crucial for determining the critical value in the t-test.
Establishing Decision Rule [2:16]
The decision rule is established based on the alpha level of 0.05 for a two-tailed test. The middle 95% of the distribution will fall between the critical values of negative 2.04 and positive 2.04. If the calculated t statistic falls outside this range, the null hypothesis will be rejected.
Calculating the T Statistic [3:26]
Using the sample mean (140), population mean (100), sample standard deviation (20), and sample size (30), the t statistic is calculated using the appropriate formula, resulting in a t value of 10.96.
Stating Results and Conclusion [3:56]
With the calculated t value of 10.96 exceeding the critical value of 2.04, the null hypothesis is rejected. This indicates that the medication significantly affected intelligence, resulting in a sample mean that differs from the expected population mean of 100. The results can be formally stated as T = 10.96 with p < 0.05, indicating statistical significance.