TLDR;
This video provides a step-by-step guide on how to calculate the mean, median, mode, and standard deviation for a given data set. It begins by defining each term and then walks through the calculations with a sample data set. Key steps include arranging the data in ascending order for median calculation, identifying the most frequent number for the mode, and using a formula involving the sum of squared differences from the mean to find the standard deviation.
- Calculating Mean, Median and Mode
- Calculating Standard Deviation
- Variance calculation
Introduction to Statistics Problem [0:01]
The video introduces a statistics problem involving a data set and outlines the task of finding the mean, median, mode, and standard deviation. The given data set is referred to as "x," and the initial instruction is to calculate the mean.
Calculating the Mean [0:37]
To calculate the mean, sum all the data points and divide by the number of data points. The sum of the data points (24, 31, 12, 38, 12, 15, 12, 28, 16, and 32) is 220. Dividing this sum by the total number of data points, which is 10, gives a mean of 22.
Calculating the Median [2:26]
The median is the middle number in a data set arranged in ascending order. The data set is first arranged as follows: 12, 12, 12, 15, 16, 24, 28, 31, 32, and 38. Since there are an even number of data points (10), the median is the average of the two middle numbers, which are 16 and 24. The median is calculated as (16 + 24) / 2 = 20.
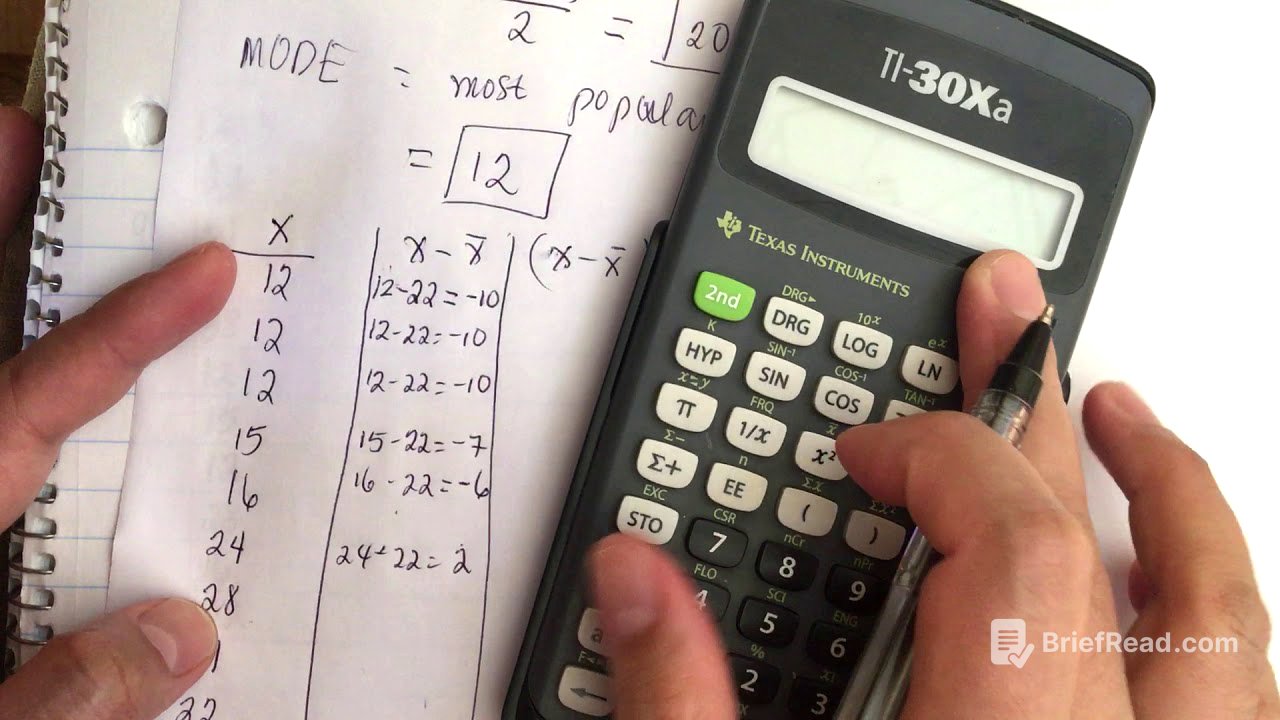
Determining the Mode [4:34]
The mode is the most frequently occurring number in the data set. In this case, the number 12 appears three times, which is more frequent than any other number. Therefore, the mode is 12.
Calculating Standard Deviation - Setting Up Columns [5:53]
To calculate the standard deviation, additional columns are created. The first column lists the data points (x) in ascending order. The second column calculates the difference between each data point and the mean (x - x̄). The third column squares the values obtained in the second column ((x - x̄)²).
Calculating x - x̄ Values [6:18]
The mean (x̄) is 22. The values for x - x̄ are calculated as follows:
- 12 - 22 = -10
- 15 - 22 = -7
- 16 - 22 = -6
- 24 - 22 = 2
- 28 - 22 = 6
- 31 - 22 = 9
- 32 - 22 = 10
- 38 - 22 = 16
Calculating (x - x̄)² Values [8:04]
The values for (x - x̄)² are calculated by squaring the x - x̄ values:
- (-10)² = 100
- (-7)² = 49
- (-6)² = 36
- (2)² = 4
- (6)² = 36
- (9)² = 81
- (10)² = 100
- (16)² = 256
Applying the Standard Deviation Formula [9:32]
The formula for standard deviation (s) is the square root of the sum of (x - x̄)² divided by (n - 1), where n is the number of data points. The sum of the (x - x̄)² values is 862. Therefore, the standard deviation is calculated as the square root of (862 / (10 - 1)) = √(862 / 9) = √95.778 ≈ 9.79.
Calculating the Variance [11:08]
The variance is the square of the standard deviation. Using the calculated standard deviation of 9.79, the variance is approximately 9.79 * 9.79 = 95.8. This value is also approximately equal to 95.778, which was the value before taking the square root for the standard deviation.