TLDR;
This video explains how to use the MACD (Moving Average Convergence Divergence) indicator in trading to avoid false breakouts and focus on trading the front side of a move. It emphasizes using standard MACD settings, understanding moving averages, and applying the MACD to various time frames and markets. The video also highlights the importance of consistency in using indicators and provides advice on knowing when to walk away from trading.
- Using MACD to avoid false breakouts and focus on front-side trading.
- Importance of standard MACD settings for universal signals.
- Understanding moving averages as a foundation for MACD.
- Applying MACD consistently across all trades.
- Recognizing when to stop trading based on market conditions.
Intro [0:00]
The video introduces the use of MACD in trading to avoid false breakouts and focus on trading the front side of a move, rather than overtrading congested price action. This indicator is applicable across various markets, including stocks, Forex, futures, and cryptocurrency, as it is a universally respected tool in technical analysis. The presenter will use a recent profitable trade as a case study to illustrate how MACD contributed to securing profits and avoiding overstaying in trades.
The MACD Explained [1:22]
MACD, which stands for Moving Average Convergence Divergence, measures the relationship between moving averages, specifically when they are diverging (moving apart) or converging (moving together). In long-term investing, moving average crossovers are significant indicators of trend changes. For example, if a stock has been declining and then begins to rise, a crossover of the 100-day moving average above the 200-day moving average can signal a potential trend reversal. These crossovers are valid on both daily and short-term time frames, making MACD a versatile tool for traders and investors.
How the MACD Works and Why It's Important [2:34]
Understanding how MACD works requires a foundation in moving averages, as MACD uses moving averages in its calculations. When a price is trending upwards, the moving average trails slightly behind because it represents the average price over a specific period. The presenter uses exponential moving averages (EMAs), which give more weight to recent price action compared to simple moving averages (SMAs). A 9-period EMA reacts faster to price changes than a 9-period SMA. When short-term and long-term moving averages stack above each other, it indicates a bullish trend. However, a moving average crossover signals a potential change in trend, which MACD helps visualize more clearly than just plotting moving averages on a chart.
How to use the MACD for Day Trading [5:44]
For day trading, MACD is plotted at the bottom of the chart with standard, default settings: a fast length of 12, a slow length of 26, and a signal length of 9, with the source set to close. Using standard settings is crucial because it ensures that traders see the same signals, making the indicator effective due to collective interpretation. Altering these settings can lead to unique signals that aren't recognized by other traders, potentially leading to misinterpretations and losses. The presenter illustrates this point by showing how changing the MACD settings can alter the signals, emphasizing the importance of using the same settings as everyone else to align with market movements driven by collective beliefs and actions.
Critical Indicator [9:36]
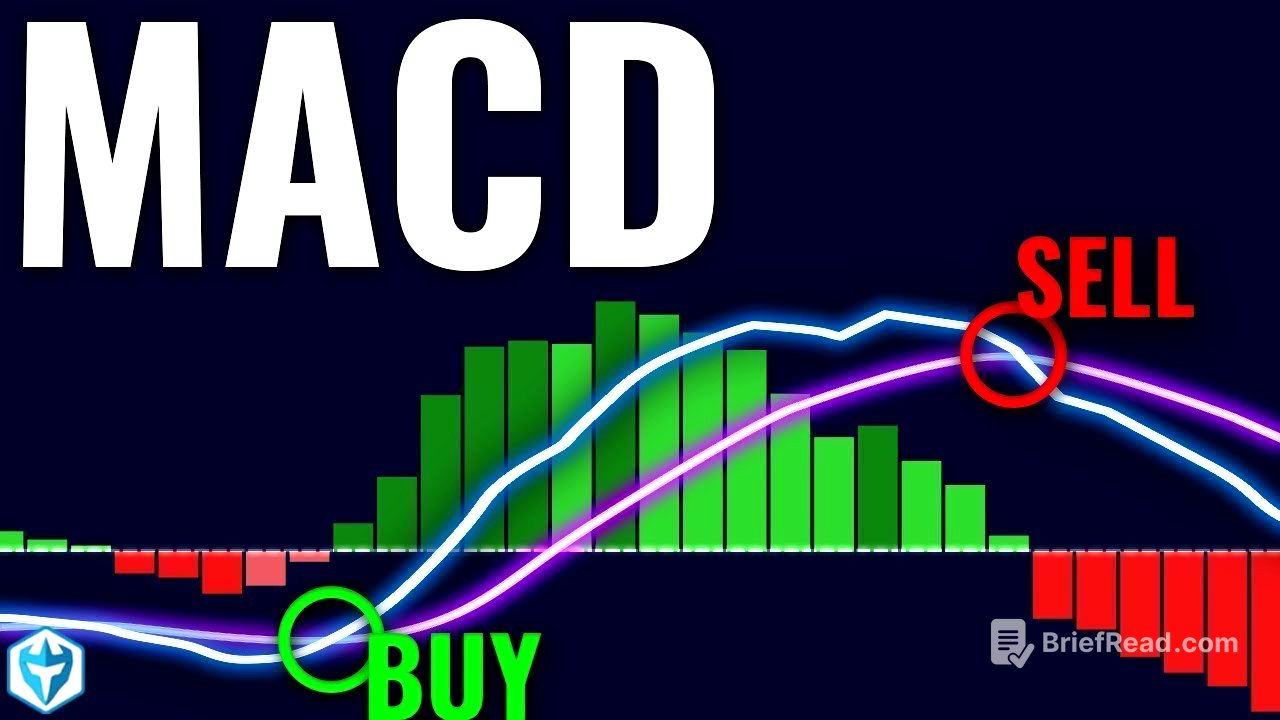
The presenter analyzes a one-minute chart of SGBX, a stock he recently traded profitably, to demonstrate MACD's application. Initially, when breaking news causes a stock to spike, moving averages diverge, with the MACD line moving significantly above the signal line. As the price stalls, moving averages converge, and a MACD crossover occurs when the MACD line crosses below the signal line. This crossover is a critical indicator to stop buying. Beginner traders should focus on trading only when the MACD is in favor of their position to increase accuracy. The presenter shows how overlaying the MACD directly on the price chart can make crossovers more visible, aiding in timely trading decisions.
Focusing on the Front Side of a Trade [16:08]
The presenter shifts focus to BNF, illustrating a scenario where the stock squeezes up without any breaking news. The MACD is positive and in favor of the trade as the stock punches higher. During the first pullback, the MACD remains open, signaling a buying opportunity. However, a significant dip occurs, and the MACD starts to turn against the trade, leading to a crossover. The presenter advises stopping trading at this point, emphasizing the importance of focusing on the front side of the move, including the initial move and the first pullback. He clarifies that he only plots the MACD directly on the chart for educational purposes, while typically keeping it at the bottom of his chart.
Using MACD Consistently [18:00]
The presenter underscores the importance of using MACD consistently on every trade to benefit from its signals. He shares his personal experience of initially using multiple indicators but eventually simplifying his charts. During the bear market of 2022, he found MACD particularly helpful in avoiding false breakouts and has since kept it on his chart. Consistent use of MACD helps traders avoid false breakouts and remember when to walk away, making it a valuable tool when applied diligently.
Ross's Technical Analysis PDF [19:32]
The presenter promotes his technical analysis PDF, which includes chart patterns, indicators, and other essential information for trading his strategy. The PDF is available for download via a link pinned in the comments section.
Recommended Books & Learning When to Walk Away [19:53]
The presenter recommends "Quit: The Power of Knowing When to Walk Away" by Annie Duke, which helped him understand the importance of walking away when the market is cold, even if daily goals aren't met. He advises detaching from specific daily profit goals and focusing on optimizing trading efficiency. Trading more hours should be reserved for days with high profitability per hour, while knowing when to walk away is crucial on less favorable days. The focus should be on maintaining discipline over consecutive days rather than fixating on consecutive green days, as discipline leads to better overall trading outcomes.