TLDR;
This video explains how to improve trading accuracy by understanding market direction using a combination of candle range analysis and volume data. It focuses on identifying key areas of liquidity and using volume to confirm directional bias, aiming for smaller, high-probability moves within a predetermined range. The method is demonstrated with examples from NASDAQ and gold, emphasizing the use of a 4-hour candle range and the importance of waiting for specific reversal triggers and volume confirmations before entering trades.
- Focus on candle range and volume data
- Aims for smaller, high-probability moves
- Uses 4-hour candle range and reversal triggers
Introduction to Directional Bias [0:00]
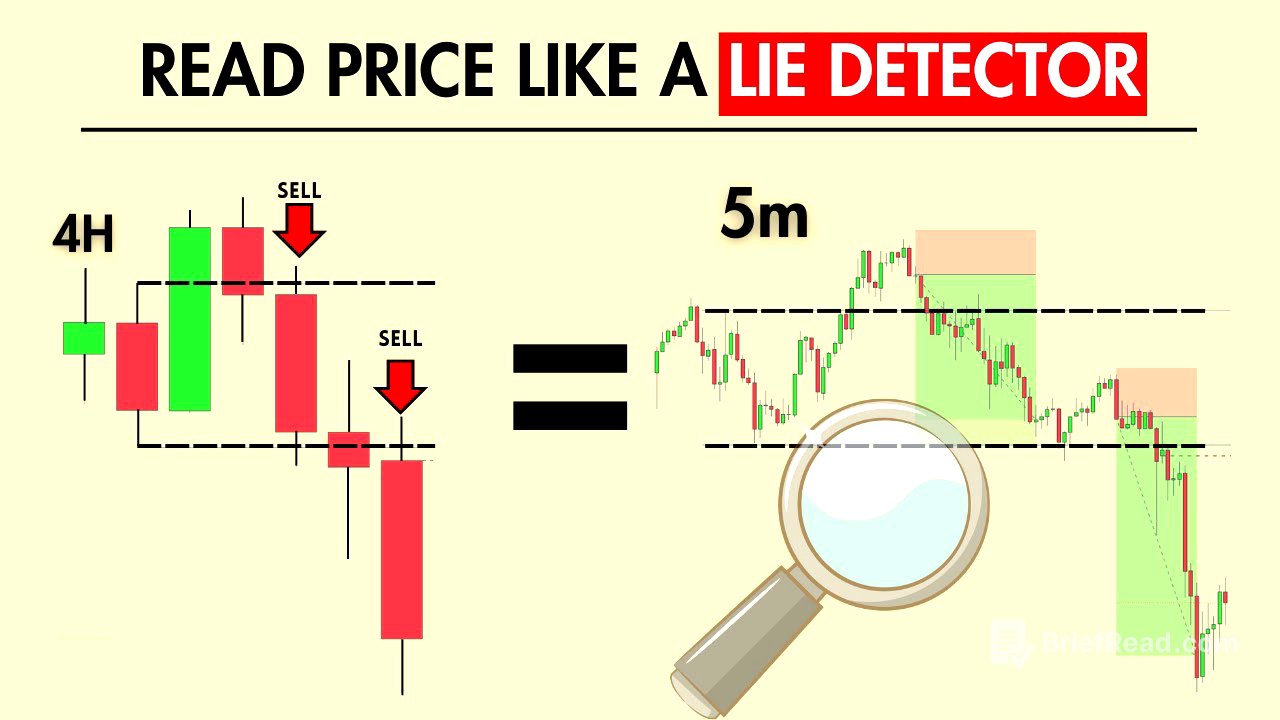
The video introduces a strategy to improve market direction prediction using candle range mechanics and volumetric information. The core of the strategy involves understanding the high and low of a 4-hour candle range to identify potential trading positions. The goal is to capture smaller, predictable movements within this range, rather than predicting long-term market trends.
Candle Range Strategy Explained [0:34]
The presenter explains the procedure of using candle range. If the price goes below the low point, the strategy looks for the price to return to the high point, because it's the most common drawn liquidity. The market seeks out untapped contracts in these areas before moving to the next area of liquidity. The presenter emphasizes waiting for specific conditions, such as a sweep or closure above the candle range high, before determining directional bias.
Volume Confirmation and Trade Entry [1:51]
After a sweep of the candle range high, the directional bias shifts towards the low of the previous candle. To avoid guesswork, the presenter uses volume to confirm the bias. By comparing the volume of bullish and bearish fair value gaps (FVG), a decision is made based on which has the higher volume. The presenter then enters a position targeting the most current low point, following the confirmed bearish direction.
NASDAQ Example: CRT Type 1 Directional Bias Model [4:02]
The presenter provides a recent NASDAQ example to demonstrate the CRT (Candle Range Trading) type one directional bias model. The strategy involves identifying the 5:00 candle high and low, waiting for a sweep of either point, and then looking for a reversal trigger on the one-minute time frame. An aggressive entry is made after a change in state, with a stop loss placed at the high and a target at the CRT low point.
Adapting to Market Reversals within Candle Range [5:08]
The presenter explains that the CRT strategy uses pivot points, where highs pivot towards lows and vice versa. The presenter illustrates how to adjust the directional bias as the market moves within the candle range, taking advantage of daily reversals even on slower, ranging days. The presenter emphasizes waiting for a strong bullish push before entering, targeting the 5:00 candle high with a stop loss at the current low.
Utilizing Volumetric Data for Trade Confirmation [6:48]
The presenter shares another example, highlighting the importance of patience and waiting for a CRT sweep before entering a trade. When unsure of the bias, volumetric information is used to support the decision. The presenter uses the Price Action Toolkit by Flux Chart to understand the volumetric info, assessing the volume in current FVGs to determine the strength of potential movements.
Applying CRT on Gold [15:03]
The presenter transitions to gold to demonstrate the CRT strategy's versatility across different assets. The same principles apply: using the 4-hour candle high and low to determine directional bias. A sweep of the high suggests a move to the downside, while a sweep of the low indicates a bullish move. The presenter waits for price to reveal its play for the day before executing a trade.
Managing Trades and Pivot Points [17:12]
The presenter describes how highs and lows act as pivot points, signaling potential reversals. After reaching a low point, the presenter looks for a pivot to the upside, entering another position with stops below the predicted low and targeting the CRT high. The presenter acknowledges potential pushback due to bearish volume and emphasizes the importance of protected stop-loss placement.
Final Example and Key Takeaways [18:45]
The presenter provides a final example to reinforce the concept that directional bias can be determined using just one candle and the CRT strategy. The presenter reiterates the steps: mark the 4-hour candle high and low, drop to a lower timeframe, and look for a sweep followed by a push in the opposite direction. The presenter emphasizes the importance of waiting for confirmation and not abandoning the bias until the right entry source is identified.