TLDR;
This video provides an in-depth guide to Candle Range Theory (CRT), explaining its principles, variations, and applications in trading. It emphasizes the importance of understanding market algorithms, identifying mechanical signatures, and combining CRT with other concepts like the power of three and turtle soups for high-probability trades. The video also covers specific entry techniques, the significance of key timing, and the psychological aspects of filtering trades to improve success rates.
- CRT is a mechanical signature within the algorithm's code.
- Combining CRT with the power of three and turtle soup gives the highest probability trades.
- Key times throughout the day have a higher probability of highs and lows forming.
Introduction to CRT [0:01]
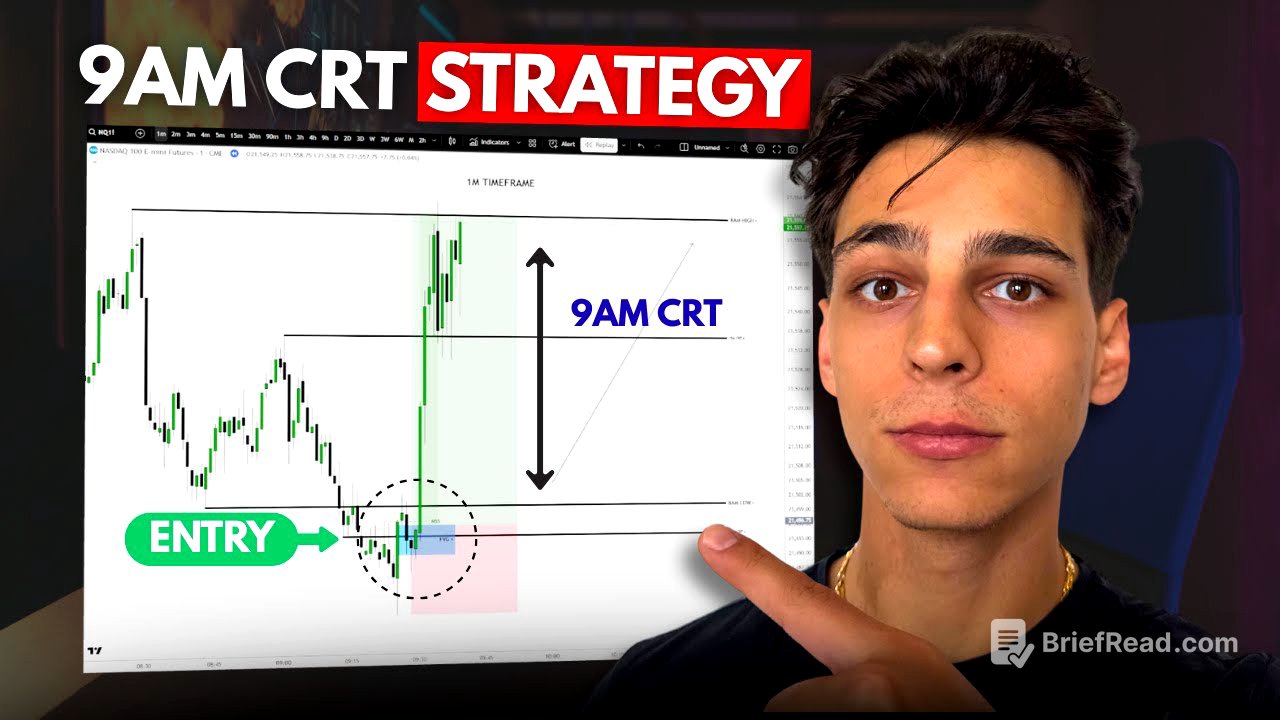
The video introduces Candle Range Theory (CRT) as a comprehensive guide for dedicated learners, distinguishing it from simple, spoon-fed approaches. CRT is the foundation for the presenter's 9 A.M. CR model, which incorporates the power of three, turtle soup, and open, high, low, and close values within a specific timeframe. The presenter clarifies that the 9 A.M. CR model is not a mere reiteration of Romeo's teachings but a unique model designed around time.
Understanding CRT [0:54]
CRT, or Candle Range Theory, typically presents as a three-candle model but can also manifest with more candles, known as CRT plus inside bar, which is considered a higher probability setup. The range is defined by the first candle, and the CRT plus inside bar takes longer to form, making it suitable for beginners or those seeking confirmation. Examples illustrate range formation, turtle soup, and movement to the opposing end of the range in both three-candle and CRT plus inside bar scenarios.
CRT as a Mechanical Signature [5:26]
CRT is described as a mechanical signature within the algorithm's code that controls the markets, with highs and lows being predetermined. It can be combined with other trading concepts, but using the power of three and turtle soup yields the highest probability trades. An example on a lower timeframe shows range formation, turtle soup, and change in state of delivery (CSD) as an entry point, with partials taken at the midpoint of the range, where reversals or continuations are likely.
Key Concepts of CRT [8:07]
The lesson emphasizes that repetition is key to becoming a strong trader. Every candle is a range on every timeframe, and time is fractal, meaning a daily chart is a higher timeframe for a 4-hour chart, and so on. Higher timeframe bias is determined by whether a higher timeframe candle has been turtle souped or not. A close above a candle's high is bullish, while a wick above is bearish, and vice versa.
Power of Three in CRT [12:20]
The power of three, also known as accumulation, manipulation, and distribution (AMD), represents three stages of price delivery. In a three-candle CRT, one candle is accumulation, another is manipulation, and the third is distribution. The power of three occurs in every candle as time is fractal. An example illustrates accumulation of sell-side and buy-side liquidity, manipulation through turtle soup, and distribution higher.
Applying CRT in Trading [13:46]
An example demonstrates forming a range high and low, wicking above the high (bearish), and distributing to the opposing end of the range. On a lower timeframe, the entry is a short at the order block after souping the range high, targeting the midpoint and then the opposing end. When trading the third candle, look for a sell opportunity above its opening price when bearish, and vice versa when bullish.
Candle Characteristics and CRT Ranges [16:00]
A candle can either be broken out of or wicked; a wick above is bearish, while a close above is bullish, and vice versa. If bullish, wait for the next candle's open and manipulate below into a higher timeframe PD array or key level for turtle soup. If bearish after a candle has been souped, focus on the third candle and look for a sell opportunity above its opening price. The change in state of delivery (CSD) is key to mastering the order block entry.
Identifying CRT Ranges [19:18]
A CRT range should be obvious, unlike a typical range. Examples show typical ranges versus CRT ranges, with clear range highs and lows and turtle souping. Focus on trading CRT ranges and filtering out other trades. The two types of CRT are the three-candle CRT and the inside bar plus CRT.
Three-Candle CRT [21:13]
The three-candle CRT consists of accumulation, manipulation, and distribution. The first candle forms the range, the second candle soups or breaks the high (turtle soup), and the third candle is the distribution leg. When bearish, sell above the third candle's open; when bullish, buy below the third candle's open. A lower timeframe example shows the first candle forming, the second souping the range high, and the third forming an order block.
Refining CRT Entries on Lower Timeframes [24:10]
Refine entries by looking for lower timeframe CRTs. The CRT low and high of a higher timeframe come from the 4-hour chart; drop to the 1-hour and look for a lower timeframe CRT. On the 15-minute timeframe, refine the entry by waiting for the candle to open and soup the low. On a 5-minute chart, wait for the candle to open and buy below the open, targeting the opposing end of the higher timeframe range.
Key Principles for Trading with CRT [26:26]
If you study CRT correctly, all you need are three candles. It's crucial to understand which candles to pick for the highest probability; it's not random. Define the range you want to trade (monthly, weekly, daily, etc.) and look for the power of three. There's always an open, high, low, and close on every candle, meaning the power of three will always be there.
Applying the Open, High, Low, and Close Theory [28:56]
In every candle, there's an open, low, high, and close, meaning there will always be accumulation, manipulation, and distribution. Price opens, accumulates low, manipulates, distributes high, and closes. Understanding this unlocks the markets. Every candle has a function: candle one is accumulation, candle two is manipulation (turtle soup), and candle three is distribution.
Combining CRT with Time and Market Structure [30:53]
Blend the candles of CRT with the times of the formation of the high and low of the day, week, month, and year to get an accurate read on the markets. If entering on candle three, it will likely be a fast and heavy trade because it's the distribution leg. Always take partials at 50% of the range, as reversals tend to happen there. If confused about the direction, ask yourself who is getting screwed over.
Understanding Turtle Soups and Market Swings [32:29]
When bullish, there will be a turtle soup, a rally, and a dump close to the turtle soup low (failure swing low). When bearish, there will be a turtle soup, a dump, and a rally close to the turtle soup high (failure swing high). Every turtle soup will have this specific swing high or low, which scares people out of the market. For this to be correct, the turtle soup low must be created at a specific time.
Entry Techniques with CRT [34:34]
The entry on the second candle is the turtle soup (most advanced entry). The second entry is the order block or change in state of delivery. The third entry is the market structure shift, breaker, or optimal trade entry. Only trade the order block when the candle that purges liquidity is thick and heavy. Candle number three provides an entry model based on the order block plus turtle soup.
Key Times and Market Consolidation [36:44]
The final key to CRT is understanding the key times when highs and lows will form. There are key times throughout the day when there's a higher probability of highs and lows forming. The market will consolidate at specific times and expand at certain times. Focus on one or two asset classes, study them, and memorize the charts. Candle number one is accumulation, candle number two is manipulation, and candle number three is fast.
Applying CRT in Different Timeframes [38:38]
Examples show range highs and lows, turtle souping, and distribution on lower timeframes. The highest probability CRT ranges form at specific times of day. Candle one is Monday, candle two is Tuesday, and candle three is Wednesday. If you want to enter on the third candle, wait for it to open and move back above the third candle's open.
Advanced CRT Techniques and Setups [41:04]
Look deeper into candle number three, where the quickest trades occur. The bias is bearish because the range high was souped, closing or wicking above the range high. Wait for price to reach above the third candle's open and turtle soup at the midpoint of Tuesday's range. A summary of the setup includes range formation, order block formation, change in state of delivery, and shorting after turtle souping at the midpoint of Tuesday's range.
Confirmations for High Probability CRT [43:49]
Specific confirmations to look for when spotting the highest probability CRT include a timed CRT range, a timed turtle soup, a high timeframe key level, CRT plus inside bars, and a lower timeframe CRT within a higher timeframe CRT. Use three or four of these confirmations for high probability models.
Validating CRT with Higher Timeframe Key Levels [45:27]
Using a higher timeframe key level to validate the CRT high and low will raise your win rate. Spot the higher timeframe key levels below or above the CRT high and low. Remember the division by four rule to find your higher timeframe key levels. If you have a CRT forming on the 15 minutes, your key level will come from the 1 hour (15 * 4).
Examples of CRT with Key Levels [48:27]
An example entails a higher timeframe key level within the lower timeframe CRT. On a 15-minute chart, the key level is coming from an hourly chart. The CRT high and low hit the key level, and as soon as price closed above the key level, it expanded above with speed. Another example shows a CRT on the 1-hour chart, with the key level coming from the 4-hour chart.
Combining Timeframes for CRT Entries [50:16]
If the CRT is performing on the monthly chart, your entries must come from a daily chart. If the CRT is from a daily chart, your entries must come from a 1-hour chart, and so on. Align yourself properly to succeed quicker. An example shows a CRT with a higher timeframe key level below or above the CRT.
High Probability CRT Setups [52:58]
A lower timeframe CRT within a higher timeframe CRT represents a high-probability trading scenario. Head over to a higher timeframe (e.g., 4-hour) and draw out your CRT high and low. Wait for one end of the range to be hit, then head to your lower timeframe (e.g., 1-hour) and draw the CRT on the candle that hit the higher timeframe CRH or CRL.
CRT and Entries Across Timeframes [57:31]
If your CRT is performing on the monthly chart, your entries must come from a daily chart. If your CRT is from a daily chart, your entries must come from a 1-hour chart. For Forex, the magic numbers are 1, 5, and 9. For futures, the magic numbers are 2, 6, and 10. These are specific times on the 4-hour chart in which you want to be looking for CRT ranges.
High Probability Turtle Soups [1:00:44]
The turtle soup needs to form at a specific time to be considered high probability. Look for turtle soups at 3:00 a.m., 6:00 a.m., and 9:00 a.m. The CRT range will form on week one of the month, and the turtle soup will occur on week two. If the CRT forms at 5:00 p.m. on the 4-hour, the turtle soup will form at 3:00 a.m.
Examples of CRT and Turtle Soup Alignment [1:04:13]
For Forex, if the CRT formed at 5:00 p.m., the turtle soup will perform at 3:00 a.m. For futures, if the CRT formed at 10:00 p.m., the turtle soup will occur at 1:00 a.m. Another example on Forex shows the CRT range forming at 5:00 a.m. and the turtle soup at 9:00 a.m.
The Filter Approach: Psychology in Trading [1:06:37]
Allow yourself to have filters on your trades and filter out low-probability trades. Save the capital for high-probability trades only. If you recognize a specific signature in price that you can always spot clearly, that is the only setup you should be executing on. Filter everything that is not A+ in your eyes out.
Risk Management and Conclusion [1:10:56]
Be sure to focus on your risk-to-reward ratio and percent gain/loss. Set a standard for yourself, whether it be 2:1, 3:1, or 5:1. Only take trades that meet your standard. Be patient. Everything you need to know about CRT is within this video. Take your time, study, and back test.