TLDR;
This YouTube video by Al Brooks from Brooks Trading Course discusses strategies for trading opening breakouts and reversals, emphasizing the importance of understanding market behavior in the first 90 minutes of the trading day. Brooks highlights two main types of breakouts: breakout mode setups and breakouts from the first 18 bars. He also touches on trading failed breakouts above yesterday's high or below yesterday's low, and trend resumption after a failed reversal. The video stresses the high probability of early highs or lows holding and provides practical advice for managing risk and identifying potential swing trades.
- Market often has strong breakout, but 50% of the time it will reverse.
- High or low of the day forms early in the day.
- Breakout mode and breakout of the range of the first 18 bars are two types of breakouts.
Introduction [0:01]
Al Brooks thanks Terry and Big Mike for the opportunity to present a webinar on trading opening breakouts and reversals. He mentions that the slides are primarily from his video training course and also include content regularly shown in his chat room. Brooks emphasizes that the market often experiences strong breakouts at the open, which can occur in either direction. It's crucial to recognize that these initial breakouts reverse about 50% of the time.
Key Points on Market Open [0:53]
Day traders should be aware that the high or low of the day typically forms early. By 8:30 AM California time, or 90 minutes into the trading day, there's a 90% chance that either the high or the low of the day has already been established. This knowledge is valuable for making informed trading decisions throughout the day. Brooks plans to discuss breakout mode setups, breakouts of the first 18 bars' range, trading reversals above yesterday's high or low, and trend resumption after failed reversals.
Examples of Breakouts and Reversals [2:09]
Brooks presents charts illustrating strong moves up or down at the open, noting that these moves often appear convincing. He points out examples of a strong bear breakout leading to a reversal up and a strong rally leading to a reversal down. Despite the strength of these breakouts, there's a 50% chance they will reverse rather than continue. These breakouts often test support during sell-offs or resistance during rallies.
Probability of Highs and Lows Forming [3:23]
At the close of the first bar, there's a 20% chance it will remain the low or high of the day. By bar 7, this probability increases to 50%. By bar 12, the end of the first hour, there's a 70% chance the high or low of the day has been seen. By bar 80, there's a 99.9% chance the high or low has occurred. Knowing that there's a 90% chance the high or low has been established by the 18th bar is particularly useful for traders.
Trading Based on the 18-Bar Range [5:31]
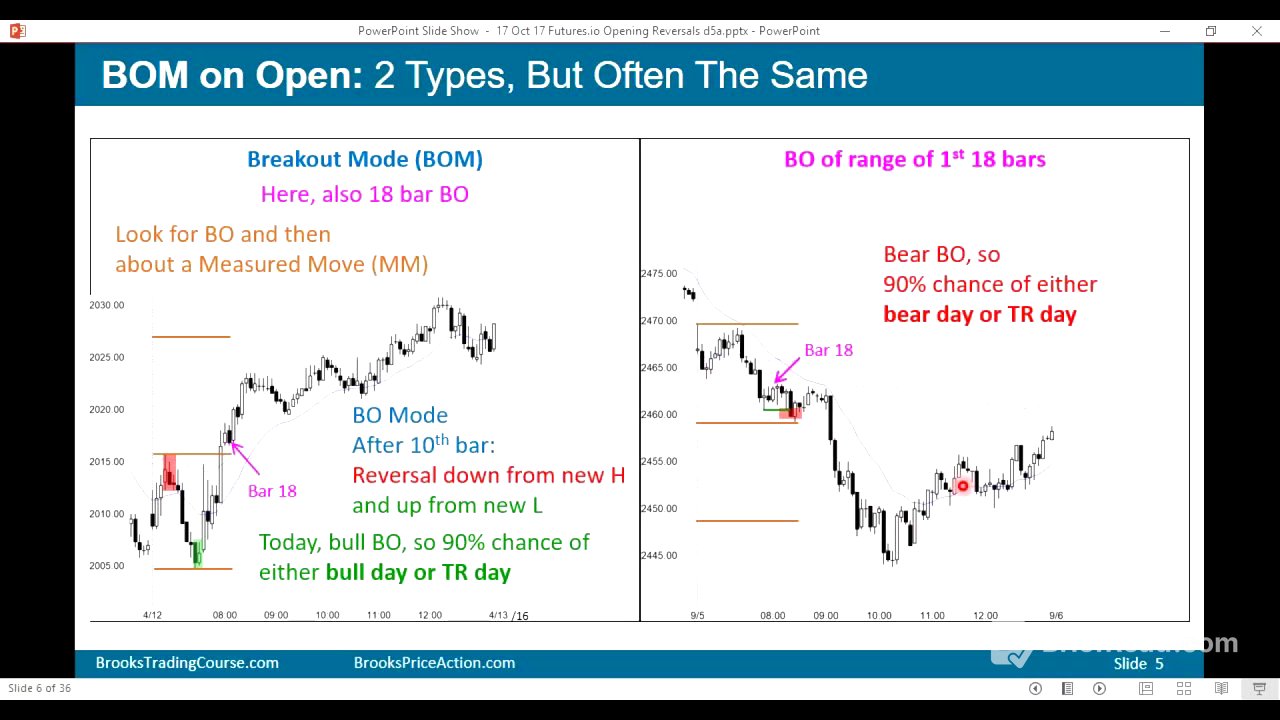
If the market breaks below the low of the first 18 bars, there's a 90% chance it won't go above the high of the day, suggesting a bear trend day or a trading range day. Conversely, if the market breaks above the high of the first 18 bars, there's a 90% chance it will be a bull trend day or a trading range day. While there's nothing magical about bar 18, it provides a high probability reference point for assessing the day's potential trend.
Breakout Mode [6:51]
Brooks defines "breakout mode" as a situation where the market reverses down from a new high and then reverses up from a new low within the first ten bars. In breakout mode, traders look for swings either above the top of the range or below the bottom. This pattern indicates that the market is searching for direction, and traders can capitalize on the volatility.
Breakout of the 18-Bar Range [7:43]
A bull breakout that coincides with a breakout of the 18-bar range has a 90% chance of leading to a bull trend day or a trading range day. Traders often look for a measured move based on the height of the opening range. Knowing that a breakout above the 18-bar range has a high probability of holding encourages traders to buy with a stop below the low, expecting either an upward trend or sideways movement.
Examples of Breakout Trades [8:42]
Brooks provides examples of days that are not classic breakout mode patterns but still offer trading opportunities based on breakouts of the 18-bar range. A bear breakout below the 18-bar range suggests a high probability that the high of the day has been set, encouraging traders to look for swing trades to the downside. He emphasizes the importance of paying attention to the high or low of the day, as it usually forms early.
Trading Breakout Mode: Stop Placement and Measured Moves [10:10]
In a breakout mode pattern, computers may be spying on stops just above the high and below the low. Traders often buy on a stop above the high, anticipating a measured move upward. The expectation is that bears trying to reverse the market have their stops just above the high of the bear leg, which bulls aim to trigger.
Entering Early and Identifying Patterns [11:13]
Traders may enter early during a breakout mode, buying the reversal up and anticipating a breakout above the top of the range. Patterns like three consecutive inside bars (III) can signal potential buying opportunities. However, smaller patterns with fewer bars are less reliable.
Bear Breakouts and Trading Range Days [12:17]
Once the market falls below a bear bar, it theoretically enters breakout mode. A second bear breakout of a larger opening range increases the probability of a bear trend day or a trading range day. In a trading range day, traders can sell rallies, knowing the probability of the market reaching a new high is low.
Pattern Size and Market Context [13:37]
When the initial range for reversals is small, traders may ignore the first reversal and focus on subsequent reversals to create a larger breakout mode pattern. Small patterns may indicate a limit order market where traders buy below bars and sell above bars, rather than trading breakouts.
Tight Trading Ranges and Failed Breakouts [15:30]
In tight trading ranges filled with doji bars, it's better to wait for a strong breakout before selling. If the market has a lot of early trading range price action, breakouts are unlikely to extend far. A big bear bar closing near its low may prompt traders to sell the close of the next bar if it also has a bear body.
Measured Moves and Reversals [16:44]
When the range is small, traders often look for the range to double, anticipating a measured move down. Buyers may include bears covering their shorts or bulls expecting profit-taking and a tradable bounce.
Wedge Bottoms and Bullish Context [17:10]
A wedge bottom with good bull bars can signal a buying opportunity, even before a breakout to a new high. Traders may front-run the breakout, anticipating a move above the 18-bar range. Waiting to buy a breakout or scaling into pullbacks are also viable strategies.
Double Top Bear Flags and Breakout Mode [17:56]
In breakout mode, selling below a bar with a double top bear flag below the moving average can be reasonable. However, a strong reversal may lead to a wedge bull flag, prompting traders to exit shorts and go long. It's common to take multiple trades before catching a swing.
Front-Running Breakouts and Multiple Entries [19:19]
When looking for a breakout mode trade, traders may need to take two or three entries before catching a swing. Selling below a bar near the moving average can be a reasonable entry, but it may fail, leading to a higher low. Bulls may buy, anticipating a breakout and a measured move up.
Breakout Mode vs. Breakout of the 18-Bar Range [20:09]
Brooks transitions to discussing the interplay between breakout mode and breakouts of the 18-bar range. He notes that sometimes a breakdown mode can also function as a breakout of the 18-bar range, offering combined trading signals.
Trading Near Bar 18 [20:51]
By the close of bar 18, there's a 90% chance that either the high or low of the day has been established. Bears who took shorts may cover their positions, especially if there's a bull reversal bar. A reversal up from the low of the day, particularly with a gap up and a bull flag, can be a strong buy signal.
Entering on Breakouts and Reversals [22:19]
Some traders prefer to enter on a stop at the breakout above the 18-bar range. Once the market moves above that high, there's a 90% chance the low of the day will hold. Near bar 18, traders may sell on a reversal down, especially if there's a small double top.
Reversal Days and Late Highs [23:52]
On reversal days, a strong initial sell-off often limits how far the market can rally above the initial high. However, a decent swing up is still possible. Even with a late high, most reversal days don't go far above the high.
Wedge Bottoms and Buying Pressure [25:09]
A wedge bottom with good bull bars can prompt traders to front-run a breakout to a new high. The context of strong buying pressure supports this strategy. Traders can buy a breakout or scale into pullbacks.
Small Patterns and Trading Decisions [26:36]
Small patterns may not be treated as breakout mode patterns, and traders may avoid buying or selling on stops. As patterns grow larger, traders become more willing to trade breakouts.
Sideways Trading and Breakout Expectations [27:30]
When there's significant sideways trading, a breakout of the 18-bar range may not lead to a bull trend. Instead, the day is likely to remain a trading range day. Traders may buy for a reversal up near the low of the day or sell for a reversal down near the high of the day.
Trading Range Days and Reversals [28:37]
In a trading range, traders prefer to buy low and sell high, scalping for profits. Breakouts may require strong follow-through to be tradable. Traders look for reversals, especially micro double bottoms, and may buy above bull bars, anticipating a swing up.
Failed Breakouts Above Yesterday's High or Low [30:17]
Brooks shifts the focus to failed breakouts above yesterday's high or below yesterday's low, which are common patterns to watch for on the open.
Common Open Patterns [30:34]
A common pattern involves breaking above yesterday's high and then reversing down. A second attempt to break above yesterday's high, followed by a good bear bar closing near its low, presents a high-probability short opportunity. The opposite is true for breaks below yesterday's low.
Second Entries and Strong Rallies [31:51]
A second entry below a bear bar after a rally can be a good short opportunity. Even with a strong rally on the open, there's a 50% chance it will fail. Traders often wait for a second reversal before selling.
Wedge Bull Flags and Trading Range Context [32:47]
A wedge bull flag after a strong breakout and gap up is a common pattern, signaling a bull trend. However, in a trading range, traders may look for a second reversal down after a breakout above yesterday's high.
Double Tops and Lower Highs [34:37]
A double top or lower high can present a good short opportunity. If the market fails to hit stops above a bull bar, and a bear bar closes near its low, traders may go short again.
Wedge Patterns and Trend Resumption [35:57]
A wedge pattern with consecutive bear bars closing near their lows can be a reasonable sell. If a wedge bottom forms and a second entry buy occurs, traders may exit shorts and buy.
Gap Downs and Bull Flags [37:56]
A gap down below yesterday's low, followed by a reversal up, can signal a second entry for a failed breakout. A bull flag after the reversal supports a buying opportunity.
Trend Resumption After Failed Reversal [40:24]
Brooks transitions to discussing trend resumption after a failed reversal. If a reversal from above yesterday's high or below yesterday's low fails, it can lead to a trend resumption.
Triangle Patterns and Bull Trend Days [40:35]
If a short trade is taken after a reversal and the market forms a triangle pattern, the bears may exit their positions. A breakout above the first 18 bars of the day can signal a bull trend day, prompting traders to get long.
Failed Reversals and Bullish Signals [42:02]
A failed reversal, where the market doesn't go down and instead reverses up, can prompt bears to exit and bulls to buy. A second reversal down may lead to a trading range.
Wedge Reversals and Double Bottoms [43:06]
A wedge reversal at the moving average can be seen as a bear flag. However, a lower low major trend reversal or double bottom can prompt bears to exit and bulls to buy.
Summary of Key Points [43:51]
Brooks summarizes the key points: strong legs up or down on the open have a 50% chance of failing and reversing. The high or low of the day often forms early, with a 90% chance of being present by the close of the 18th bar. Traders look for breakouts of the 18-bar range. Breakout mode setups involve reversals from new highs or lows. Failed breakouts above yesterday's high or below yesterday's low offer high-probability trades. Any pattern can fail, potentially leading to trend resumption.
Q&A - Impact of Computer Trading on Volatility [45:28]
In the Q&A, Brooks addresses whether increased computer trading has led to decreased volatility. He argues that markets are becoming more perfect due to faster, more rational computer trading, but low volatility is often a precursor to high volatility. He notes that the market goes through cycles of high and low volatility.
Q&A - Timeframe and Account Size [48:02]
Brooks confirms he uses 5-minute charts. He recommends trading with as much capital as possible, suggesting at least $5,000 to start, and trading Forex markets with smaller accounts.
Q&A - Fractal Nature of Markets and Trend Lines [50:24]
Brooks agrees that markets are fractal, behaving similarly on all time frames. He mentions that he is always putting lines on his chart and looking for a break of the trendline.
Q&A - Moving Averages and Scaling In [54:01]
Brooks uses the 60-minute 20-bar exponential moving average on his charts. He scales in depending on whether his premise is still valid, adding to positions if he believes the trade is still good.
Q&A - Scaling In and Momentum Trading [55:44]
Brooks explains that value traders tend to scale in, while momentum traders do not. He adjusts his position size based on market conditions, trading smaller when expecting a deep pullback.
Q&A - Swing Trades vs. Scalps and Trading Styles [59:34]
Brooks notes that it's more common to convert swing trades into scalps than vice versa. He emphasizes that high winning percentages typically indicate scalping.
Q&A - Trading Other Futures Markets and Favorite Traders [1:00:52]
Brooks states that his approach applies to all futures markets, as trading is based on rational decisions. He dismisses Gann and Elliott as "idiots" and prefers Warren Buffett and Carl Icahn for understanding human behavior.
Q&A - Automated Trading and Cryptocurrency [1:05:42]
Brooks shares his experience with automated trading, noting that he prefers discretionary trading due to his ability to see exceptions. He expresses discomfort with cryptocurrencies due to security concerns and prefers waiting for cryptocurrency ETFs.