TLDR;
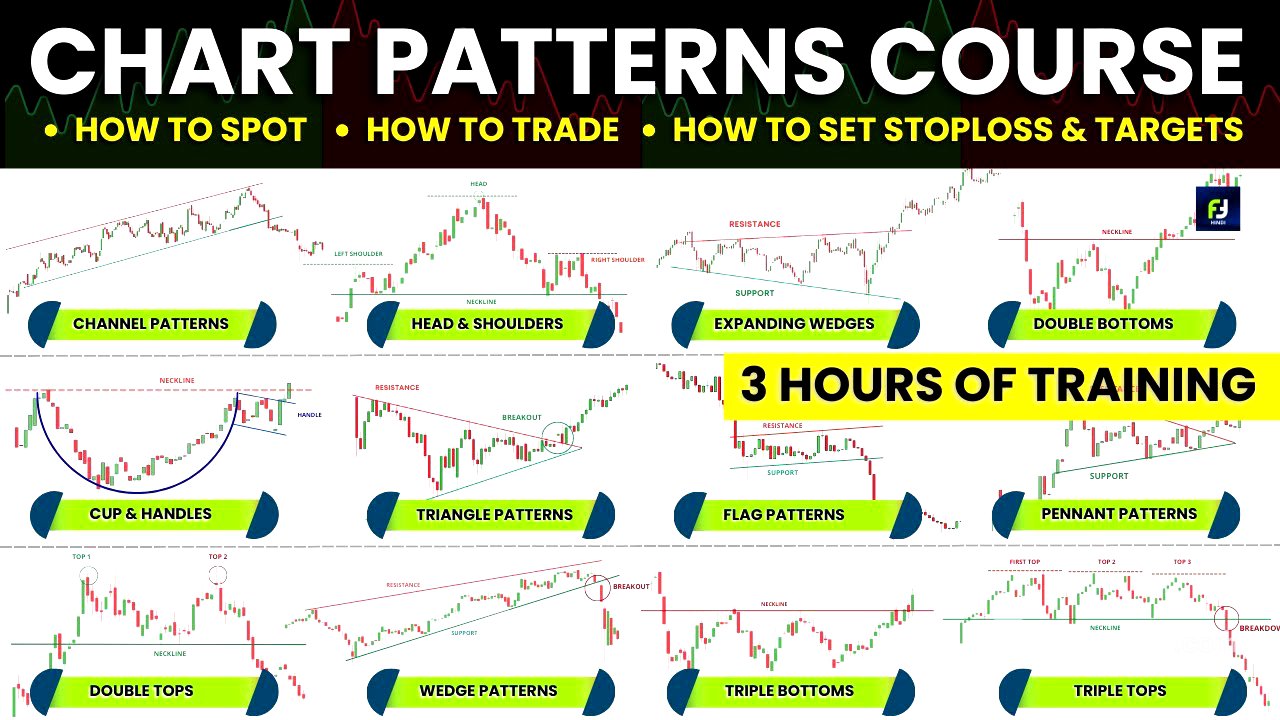
This YouTube video by Fortune Talks provides a comprehensive guide to understanding and trading chart patterns, focusing on continuation patterns, reversal patterns, and neutral patterns. It explains how these patterns reflect market supply and demand, offering insights into potential price movements. The video also covers specific strategies for identifying entry points, setting stop losses, and determining profit targets, along with various tools and techniques to improve trading accuracy and risk management.
- Chart patterns represent market supply and demand.
- Continuation patterns signal the continuation of an existing trend.
- Reversal patterns indicate a potential change in trend direction.
- Neutral patterns suggest a breakout in either direction is possible.
- Proper risk management, including stop-loss placement and target setting, is crucial for successful trading.
Introduction to Chart Patterns [0:03]
The video introduces chart patterns as representations of market supply and demand, which influence price trends. While price movements may appear random, chart patterns are geometric shapes within price data that help traders understand price action and predict future movements. It emphasizes that chart patterns are not guaranteed predictors of success and should be used with other market analysis methods. The video will cover continuation, reversal, and neutral chart patterns, focusing on five common continuation patterns with entry, stop-loss, and target setups.
Continuation Chart Patterns [2:05]
Continuation chart patterns signal that the existing trend will likely continue. These patterns often form during consolidations between trends, representing a "tea break" for the market. The video will discuss flag patterns, pennants, ascending and descending triangles, rectangle patterns, and cup and handle patterns. These patterns can form in any time frame, but they are more reliable in higher time frames due to increased awareness among traders. The specific time frame for trading these patterns depends on the trader's style, position duration, and expectations.
Bullish Flag Pattern [3:38]
The bullish flag pattern forms during an uptrend, starting with a strong bullish move followed by a minor bearish correction with parallel tops and bottoms. Key components include a preceding up move (flagpole) and a shallow pullback with small-range candles, indicating that sellers are struggling to lower the price. To trade this pattern, enter long after a breakout above the resistance line or wait for a pullback to the breakout level. Stop losses should be placed below the bottom trend line support, ideally using an ATR indicator for extra safety. Targets can be set based on the length of the flagpole (price projection method) or by trailing the stop loss. Four scenarios to trade the bull flag include formations during a level breakout, in an uptrending market, inside a range market, and in a downtrend signaling a trend reversal.
Bearish Flag Pattern [16:07]
The beer flag pattern is the opposite of the bull flag, signaling a likely downward market movement. It begins with a strong bearish move, followed by a pullback with smaller range candles. The pullback should not exceed 50% of the pole length. To trade, look for shorting opportunities when the price breaks below the support trend line, waiting for the breakdown candle to close for confirmation. Place stop losses above the resistance trend line, using an ATR buffer for safety. Targets can be set using the price projection method or a trailing stop loss. Bear flags can be found during a support line breakdown, in a downtrend, in a range market with a build-up near support, and at the end of an uptrend signaling a trend reversal.
Bullish Pennant Pattern [21:05]
Bull pennants form a triangle during a pullback in an uptrend, consisting of an impulse move (leg) and a correction move. Unlike symmetrical triangles, bull pennants have crowded candles and create more explosive breakouts than bull flags due to the shrinking price range. To trade, wait for the bullish breakout candle to close above the pennant line, then buy above the breakout candle's high. Validate breakouts with decreasing volume during consolidation and higher than average volume during the breakout. Place stop losses below the bottom trend line support, using an ATR indicator for buffer. Targets can be set using the price projection method or a trailing stop loss. Bull pennants can be found in uptrends, range markets, and downtrends (as a trend continuation after a break in the downtrend structure).
Bearish Pennant Pattern [32:09]
The beer pennant is the opposite of the bull pennant, characterized by a strong bearish leg followed by a tight consolidation. The price is expected to break explosively below the trendline support. To trade, enter when the breakout candle closes below the trendline support, shorting below the low of the breakout candle. Validate the breakdown with declining volume during pennant formation and increasing volume during the breakout. Place stop losses above the swing high level, using an ATR buffer. Targets can be set using price projection or a trailing stop loss. Bear pennants can be found in downtrends, range markets (breaking below support), and at the end of uptrends (after a break in the uptrend structure).
Ascending Triangle Pattern [34:13]
The ascending triangle is a bullish chart pattern with a series of higher lows approaching a resistance line, signaling a likely upward breakout. This pattern indicates bullish strength due to buyers willing to buy at higher prices and a lack of selling pressure. To trade, go long when the price breaks above the resistance or wait for a pullback to the resistance line. Place stop losses below the recent swing low, using an ATR buffer. Targets can be set using the price projection method (calculating the width of the triangle and projecting it from the breakout point) or a trailing stop loss. Combining both methods is recommended.
Descending Triangle Pattern [41:05]
The descending triangle is a bearish chart pattern with a series of lower highs coming into an area of support, signaling strong selling pressure and a likely downward breakout. To trade, go short when the price breaks below the support level, ideally near the apex of the triangle. Use a limit sell order at the breakout point or wait for a retest of the breakdown point. Place stop losses above the most recent swing high level, using an ATR buffer. Targets can be set using the price projection method or a trailing stop loss.
Rectangle Patterns [46:53]
Rectangle patterns are formed by horizontal support and resistance lines, representing a pause in the current market trend. A top rectangle forms during an uptrend, signaling continuation, while a bottom rectangle forms during a downtrend, also signaling continuation. To trade a top rectangle, enter long when the price breaks above the resistance level, waiting for confirmation or a pullback. For a bottom rectangle, enter short when the price breaks below the support level. Place stop losses in the middle of the rectangle's width. The minimum target should be equal to the width of the pattern, providing a 2:1 reward-to-risk ratio. Alternatively, trade within the rectangle by buying at support and selling at resistance.
Cup and Handle Pattern [53:34]
The cup and handle pattern can be both a continuation and a reversal pattern, but it is expected to give a bullish breakout. The pattern includes a cup, a handle, and a neckline (resistance). The cup forms after a bearish decline followed by consolidation, while the handle forms a tight consolidation under the resistance level. To trade, enter long on the breakout above the handle or the neckline, waiting for confirmation. Place stop losses below the handle, using an ATR buffer. Targets can be set using the price projection method (measuring the height of the cup) or a trailing stop loss. The inverted cup and handle pattern is the opposite, giving a bearish breakdown.
Reversal Chart Patterns [1:01:33]
Reversal chart patterns signal that the existing trend will likely reverse. These patterns form as consolidations between trends, indicating a shift in market direction. The video will discuss head and shoulders, double tops and bottoms, triple tops and bottoms, and rising and falling wedges.
Head and Shoulders Pattern [1:02:48]
The Head and Shoulders pattern is a popular reversal pattern consisting of a left shoulder, a head, a right shoulder, and a neckline. It signals a possible trend reversal as buyers fail to push prices higher. The right shoulder should be shallow (below 50% of the head). To trade, wait for the breakdown candle to close below the neckline, or look for a build-up near the neckline, a primary pullback, or a retest. Place stop losses above the right shoulder or above the build-up consolidation. Targets can be set using the price projection method or a trailing stop loss.
Inverse Head and Shoulders Pattern [1:14:53]
The inverse head and shoulders pattern is a bullish reversal pattern, the mirror reflection of the head and shoulders pattern. It signals that buyers are in control. The right shoulder should be above 50% of the head. To trade, wait for the breakout candle to close above the neckline, or look for a build-up near the neckline, a primary pullback, or a retest. Place stop losses below the right shoulder or below the build-up consolidation. Targets can be set using the price projection method or a trailing stop loss.
Double Top Pattern [1:24:55]
The double top is a bearish reversal pattern with two peaks and a neckline (support). It signals that the market is unable to go higher. The space between the peaks should be far apart. To trade, wait for the breakout candle to close below the neckline, or look for a build-up near the neckline, a primary pullback, or a retest. Place stop losses at 50% of the distance between the swing top and the neckline or use an ATR indicator. Targets can be set using the price projection method or a trailing stop loss. Use multiple time frame analysis to identify high probability setups.
Double Bottom Pattern [1:35:36]
The double bottom pattern is a bullish trend reversal pattern, the opposite of a double top. It has two lows and a neckline (resistance). To trade, wait for the breakout candle to close above the neckline, or look for a build-up near the neckline, a primary pullback, or a retest. Place stop losses at 50% of the distance between the swing bottom and the neckline or use an ATR indicator. Targets can be set using the price projection method or a trailing stop loss. Use multiple time frame analysis to identify high probability setups.
Triple Top and Triple Bottom Patterns [1:44:23]
Triple tops and triple bottoms are extensions of double top and double bottom patterns. A triple top is a bearish reversal pattern, while a triple bottom is a bullish reversal pattern. The entry, exit, and stop-loss criteria are the same as with double top and double bottom patterns.
Rising Wedge Pattern [1:46:54]
A rising wedge is a bearish pattern that starts wide at the bottom and contracts as the price moves upwards. It can be both a reversal or a continuation pattern, but it is generally bearish. To trade, wait for the price to break below the upward sloping support trendline. Place stop losses one ATR above the most recent swing high level. Targets can be measured by taking the distance of the back of the wedge and extending it down from the trend line breakout point.
Falling Wedge Pattern [1:53:58]
A falling wedge is a bullish pattern created when a market consolidates between two converging support and resistance lines. It can be both a bullish continuation and a bullish reversal pattern. To trade, go long when the price breaks above the resistance trend line. Place stop losses one ATR below the most recent swing low. Targets can be measured by taking the distance of the top of the wedge and extending it upward from the trendline breakout point.
Neutral Chart Patterns [1:59:58]
Neutral chart patterns, also known as bilateral chart patterns, do not have a directional bias. The breakout can be in either direction. The video will discuss symmetrical triangles, symmetrical expanding triangles (broadening triangles), and channel patterns (rising and falling channels).
Symmetrical Triangles [2:02:00]
The symmetrical triangle is a volatility contraction pattern where the price volatility shrinks, signaling a likely breakout. The sides of the triangle slope equally. To trade, wait for a breakout above the descending trendline resistance or a breakdown below the ascending trendline support. Place stop losses below the recent swing low (for a bullish breakout) or above the recent swing high (for a bearish breakdown), using an ATR buffer. Targets can be set using the price projection method or a trailing stop loss.
Symmetrical Expanding Triangles (Broadening Triangles) [2:12:35]
The symmetrical expanding triangle, or broadening triangle, is the opposite of a symmetrical triangle. The price expands with each swing. To trade, wait for a breakout above the upper trendline resistance or a breakdown below the lower trendline support. Place stop losses in the middle of the pattern or with respect to the breakout candle, using an ATR buffer. Targets can be set using the price projection method.
Channel Patterns (Rising and Falling Channels) [2:18:47]
Channel patterns include rising and falling channels. A rising channel is formed by an uptrend line (support) and a trend channel line (resistance). A falling channel is formed by a downtrend line (resistance) and a trend channel line (support). To trade, take breakout trades when the price breaks out of the channel or trade the impulse price swings in the direction of the trend. Place stop losses depending on the width of the channel, using an ATR buffer. Targets can be set using the price projection method or a trailing stop loss.
Methods for Spotting Chart Patterns [2:33:25]
The video discusses three methods for spotting chart patterns: using inbuilt TradingView indicators, using Top Stock Research pattern scanner, and using charting and Zerodha Streak screeners.
TradingView Indicators [2:36:47]
TradingView has inbuilt indicators for spotting chart patterns. Select the chart and time frame, then go to the indicator section and select "Auto." Choose the desired chart pattern. Adjust the "permissible deviation" parameter to control the accuracy of the pattern formation. Enable the "in progress" checkbox to track upcoming patterns.
Top Stock Research Pattern Scanner [2:43:29]
Top Stock Research pattern scanner is an automatic screener for chart patterns. Go to "Price Screened" and select "Chart Patterns." Choose the desired pattern and time frame. The free version provides a limited number of results. The scanner shows the prices at which the pattern formation took place and has a built-in chart feature.
Charting and Zerodha Streak Screeners [2:47:43]
Charting and Zerodha Streak are powerful screeners with more control. Charting has many chart pattern screens already available. Search for the desired scan and filter stocks based on your requirements. Zerodha Streak requires an account with Zerodha. Create new scans by copying the code logic from Charting.


![The Digimon Multiverse & Timeline(s) - An 11 HOURS IN-DEPTH ANALYSIS [Digimon Conversation #104]](https://wm-img.halpindev.com/p-briefread_c-10_b-10/urlb/aHR0cDovL2ltZy55b3V0dWJlLmNvbS92aS9FbWtaQXlxc3R3US9ocWRlZmF1bHQuanBn.jpg)