TLDR;
This video provides a tutorial on how to use a nano VNA to measure and optimize antenna tuning. It covers setting up the VNA to display reflection coefficient, SWR, and Smith chart, calibrating the device for accurate measurements, and using the VNA's display to guide antenna tuning adjustments. The video demonstrates how to retune an antenna for a specific frequency band by observing real-time changes on the VNA.
- Setting up nano VNA for antenna measurement using reflection coefficient, SWR and Smith chart.
- Calibrating the VNA for accurate measurements.
- Tuning antenna using real-time feedback from the VNA display.
Introduction [0:00]
The video introduces the use of a nano VNA h4 for measuring and optimizing antenna tuning. It mentions that antenna measurement can be done using the reflection coefficient, SWR, or the Smith chart, and indicates that all three will be used in the demonstration.
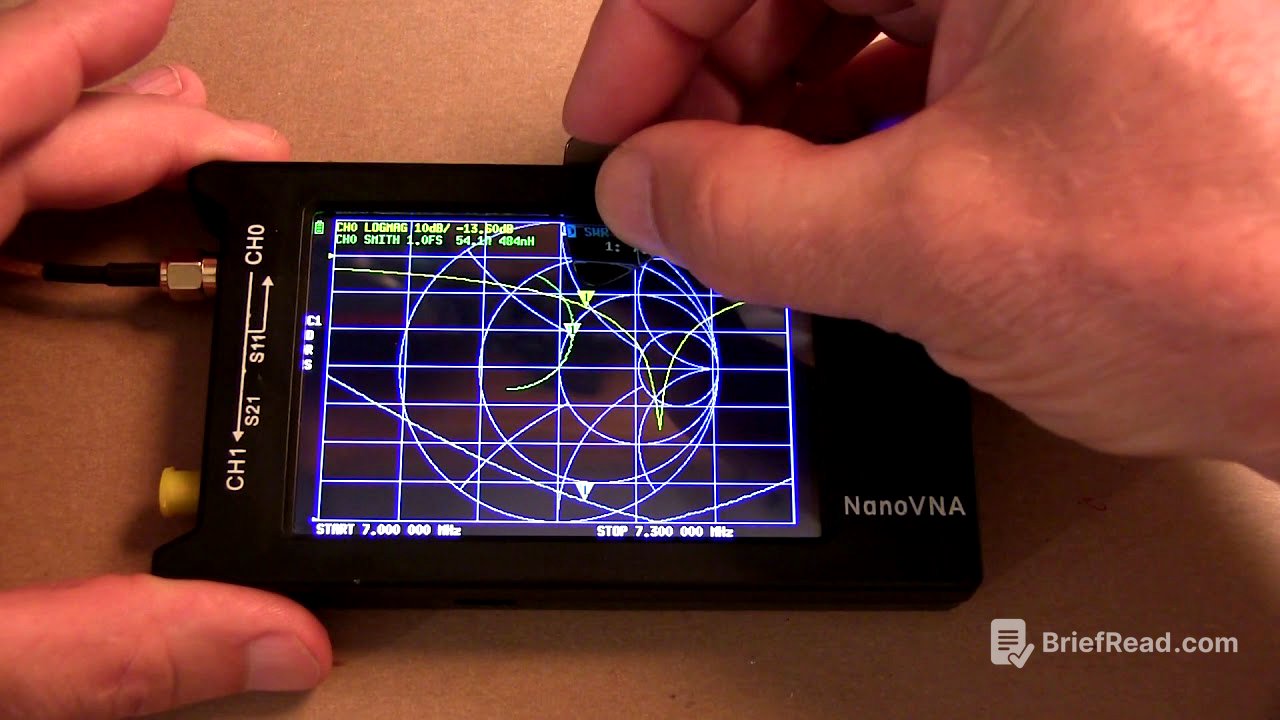
Configuring the Nano VNA Display [0:21]
The presenter configures the nano VNA display to show the log magnitude of the reflection coefficient (yellow trace), the Smith chart (green trace), and the SWR (blue trace). The purple trace is removed from the display. This setup allows for a comprehensive view of the antenna's performance.
Setting the Frequency Range [1:06]
The frequency range for testing is set to the 40-meter amateur radio band, specifically from 7 MHz to 7.3 MHz. This range is configured using the stimulus settings on the nano VNA, allowing the user to focus on a specific band of interest.
Calibration Process [1:38]
To ensure accurate measurements, the nano VNA is calibrated by resetting the existing calibration and performing an open, short, and load calibration. This involves connecting each standard to the VNA and saving the calibration to a memory location.
Initial Antenna Measurement [2:42]
With the antenna connected, the SWR plot, log magnitude of the reflection coefficient, and Smith chart are displayed. The jog wheel is used to move the cursor and make measurements at different frequencies. The marker function is used to find the minimum SWR.
Retuning the Antenna [3:34]
The presenter adjusts the antenna tuner while observing the real-time reaction on the VNA display. The Smith chart is particularly useful for understanding how the tuner controls affect the antenna's performance. The goal is to retune the antenna's resonant point to the CW portion of the band.
Fine-Tuning and Optimization [4:40]
By adjusting the inductor and capacitor on the antenna tuner, the presenter moves the marker on the Smith chart closer to the center, deepens the null on the reflection coefficient, and achieves an SWR of approximately 1.02 at the desired frequency. This demonstrates the process of fine-tuning the antenna for optimal performance.
Conclusion [5:47]
The video concludes by encouraging viewers to try the demonstrated techniques and provide feedback. It also mentions plans for future nano VNA videos and encourages viewers to subscribe for more content.