TLDR;
This video serves as the first official teaching installment, focusing on elements of a trade setup within the context of Futures index trading, particularly the Nasdaq e-mini Futures. It emphasizes paper trading on TradingView for practice, while also contrasting it with real-time trading examples. The goal is to teach viewers how to independently identify specific setups, focusing on high-probability, high-handle moves rather than small, frequent trades.
- Focus on Nasdaq e-mini Futures for index trading.
- Use TradingView for paper trading and backtesting.
- Identify setups with significant handle potential.
- Understand liquidity pools and market structure.
- Aim for independent trading without reliance on signals or blackbox systems.
Introduction and Expectations [0:13]
The video is the first teaching installment, following an introductory video that set expectations for the mentorship. The primary focus will be on Futures index trading, specifically the Nasdaq e-mini Futures contract. The teachings will be presented using TradingView's paper trading module, but the instructor also shows real-time trading examples from his own account to provide a contrast. The aim is to teach viewers how to find specific setups independently, without relying on external signals or systems.
Focus on Nasdaq e-mini Futures [0:57]
The mentorship will focus on intraday price action for Nasdaq e-mini Futures, which the instructor believes is valuable for learning how to anticipate market movements. While the principles can be applied to other markets like the E-mini S&P and E-mini Dow, the Nasdaq is highlighted for its faster and more aggressive nature. The goal is to teach viewers how to identify specific setups in a demo account, not to encourage live trading with real funds.
Understanding Handle Movements and Market Dynamics [2:23]
The discussion covers the concept of "handles," which represent price increments in index futures contracts. A handle in the E-mini S&P is equivalent to four ticks or $50, while in the Nasdaq, it's $20. The instructor notes that while the Nasdaq can be more volatile, it doesn't always move faster than other indices. He emphasizes the importance of understanding market structure and identifying setups that offer substantial handle movements, rather than focusing on small, frequent trades.
Comparing Trading Styles and Promoting Independence [6:38]
The instructor contrasts his trading approach with others on YouTube, emphasizing that he aims to teach independent thinking rather than reliance on blackbox systems or signal services. He highlights the importance of being able to analyze the chart and make decisions without external assistance. The goal is to empower students to find setups on their own, fostering independence and self-reliance.
Weekly Market Analysis and Bias [12:42]
The instructor recommends analyzing the weekly chart of the Nasdaq futures contract (NQ=F) on TradingView to determine the likely direction of the next weekly candle. This sets the initial bias for the week, informing whether to expect higher or lower prices. Factors influencing this bias include seasonality, Federal Reserve interest rate decisions, and earnings season volatility. The key is to identify what the market is likely to "draw to," considering price levels and seasonality as magnetic impulses.
Daily Chart and Liquidity Analysis [16:35]
The daily chart is used to identify swing highs and swing lows, which represent areas of liquidity. The instructor explains that the market's movement is driven by either running to stops (liquidity) or filling imbalances. He defines imbalances as situations where price moves in one direction without an efficient delivery on the opposite end. The overall strategy involves anticipating stop hunts and understanding how algorithms manipulate the market to engineer liquidity.
Hourly Chart and Weekly Range Framework [19:13]
The hourly chart is used to frame the weekly range, with a focus on identifying key levels and potential areas of liquidity. The instructor points out how the market often consolidates before making a move to take out either buy stops above short-term highs or sell stops below short-term lows. This "stop hunt" behavior is a key element in understanding how smart money operates.
15-Minute Chart and Liquidity Engineering [23:05]
On the 15-minute chart, the instructor highlights how the market often breaks down initially to induce shorts before reversing to take out buy stops. This is described as a "sucker play" designed to trap breakout traders. The algorithms then target areas of resting liquidity, using buy stops as counterparties for smart money looking to sell at a high price.
Two-Minute Chart and Imbalance Identification [26:37]
The two-minute chart is used to identify imbalances, which are key triggers for entries. The instructor explains that high-frequency trading algorithms often operate on very short timeframes, seeking out these small imbalances. After a run on buy stops, the market creates a short-term low and then breaks below it, signaling a "Break in Market Structure." The subsequent rally into the imbalance provides a high-probability short entry.
Fair Value Gaps and Algorithmic Delivery [29:12]
The instructor introduces the concept of a "fair value gap," which is an imbalance where a candle moves in one direction without overlap from previous or subsequent candles. He emphasizes that the market is manipulated by an algorithm that controls price delivery. The strategy involves waiting for the market to rally into the fair value gap after a break in market structure, then selling short with a stop loss above the high.
Liquidity Matrix and Target Identification [35:10]
The "liquidity matrix" is introduced as a tool for identifying downside objectives. It involves splitting the day's range (from low to high) and using the 50% level as a reference point. Anything above the 50% level is considered a "premium" market, while anything below is a "discount." The algorithm aims to move from premium to discount, targeting sell stops and imbalances below the 50% level.
Precision Elements and Trade Management [39:16]
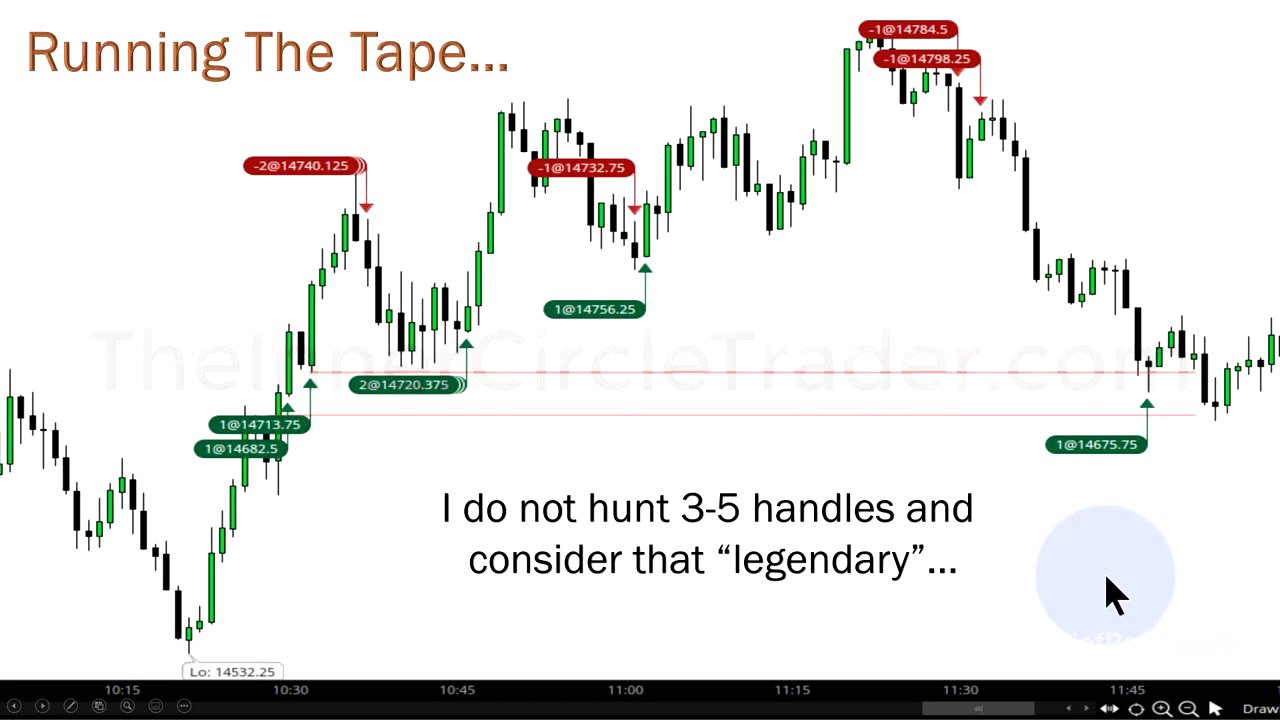
The instructor emphasizes the precision of the setups, highlighting how the market often moves from the entry point to the target with remarkable accuracy. He advises focusing on the "low-hanging fruit" and not getting greedy by trying to target the absolute lowest low. The key is to identify repeating patterns and elements in price action to achieve consistent profitability.
Homework Assignment and Future Lessons [46:20]
The homework assignment involves reviewing e-mini Futures Contract charts, identifying breaks in market structure, fair value gaps, and potential targets. The goal is to log and backtest the number of handles offered by these setups. The next lesson will build on this foundation, providing more insights on how to find these repeating setups and log them in a trading journal.