TLDR;
This YouTube video provides a weekly market outlook, focusing on major forex pairs and gold, using the presenter's unique SMC fractals strategy. The presenter identifies valid points of interest (POIs) and trading ranges, emphasising the importance of understanding market structure and avoiding counter-trend trading. The video also includes a giveaway of a free $6,000 funded account at the end.
- Identifies valid points of interest (POIs) and trading ranges
- Emphasises the importance of understanding market structure
- Discourages counter-trend trading
- Offers insights on correlated pairs and risk management
- Includes a giveaway of a free $6,000 funded account
Intro and Announcements [0:01]
The presenter welcomes viewers to the live weekly outlook, which covers major forex pairs based on his strategy. He mentions that he monitors the chat for questions and will give away a free $6,000 funded account at the end of the stream. The presenter also mentions that he will change his chart colours to red and green for educational purposes and for beginner friendly experience.
EUR/USD Analysis [4:47]
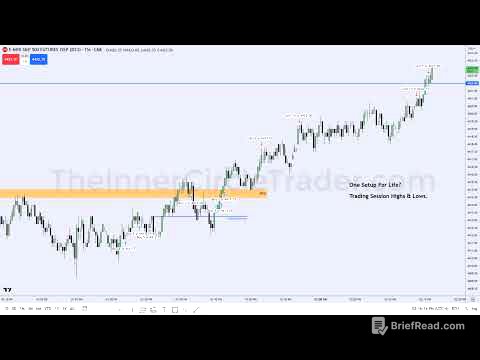
The presenter begins by analysing EUR/USD, identifying the current market sentiment as bullish due to multiple breaks of structure to the upside. He stresses the importance of identifying the current trading range to understand the overall bias and avoid potential losses from focusing on lower time frames. The current trading range is defined by the high and low points, with recent pullbacks being considered too small to be valid. The presenter then adapts to more aggressive pullbacks by adjusting the Fibonacci retracement levels and identifies a one-hour POI. He explains that he needs a confirmation on the 15-minute chart, specifically a change of character or break of structure to the upside, before considering a trade.
Gold Analysis [16:55]
The presenter analyses gold, noting that it is overall bullish but currently experiencing a pullback. He explains that one break to the downside is not enough to confirm a reversal; a further break below the previous range low is needed. He identifies an extreme point of interest (POI) on the one-hour chart for potential buys, but emphasises the need for confirmation on the 15-minute chart. He sets alerts for a break of structure to either the upside or downside to identify potential trading opportunities.
GBP/USD Analysis [21:06]
The presenter analyses GBP/USD, noting similarities to EUR/USD but highlighting that GBP/USD has only had one small pullback, which isn't significant enough to change the trading range. The range remains from the low to the high. POIs below the 0.5 Fibonacci level are considered overall POIs, while those above can be considered internal on the one-hour timeframe. He identifies potential internal trades but advises lowering risk due to their weaker nature.
Q&A on Trading Strategies [22:57]
The presenter answers questions from viewers, including whether he trades GU (GBP/USD), which he has just analysed. He discusses considering correlated pairs and splitting risk. He confirms that both EUR/USD and GBP/USD are overall bullish. He clarifies that he only considers external break of structures and that a good pullback needs to retrace close to 0.5% of the Fibonacci of the structural range. He explains that he doesn't provide signals but offers a course with in-depth explanations of his strategy.
USD/JPY Analysis [27:03]
The presenter analyses USD/JPY, identifying a four-hour range and one-hour POIs. He notes that price has tapped into one of the one-hour POIs and is waiting for a 15-minute break of structure to confirm a valid entry. He adds alerts for when price breaks the high, noting that everything below that is internal and not relevant.
GBP/JPY Analysis [29:02]
The presenter analyses GBP/JPY, noting aggressive price action and a small pullback. He explains that another pullback and break of structure to the upside are needed to confirm the price action. Internally, there are no new developments, with the same old one-hour POIs remaining valid. He points out liquidity and inducement in the area, suggesting potential buys when price pushes down to the one-hour internal POI.
USD/CHF Analysis [30:46]
The presenter analyses USD/CHF, describing the price action as very aggressive. He notes a small pullback and explains that, despite its size, it can be considered part of a new range due to the aggressive price action. He identifies a four-hour POI but notes issues with the 15-minute break of structure due to the small structure. He identifies other one-hour POIs above, noting inducement liquidity for both.
USD/CAD Analysis [35:14]
The presenter analyses USD/CAD, noting a recent shift from bullish to bearish. He identifies breaks of structure to the downside and suggests looking for counter-trend sells. He identifies a four-hour POI as the only valid one for now, explaining that a further break of structure to the downside will create a new range for potential sells.
AUD/USD Analysis [36:41]
The presenter analyses AUD/USD, noting a return to bullish momentum after a bearish phase. He identifies a previous trade from the prior week and highlights a four-hour POI. He mentions a small pullback, keeping the structure large. He identifies a smaller one-hour POI and notes the potential for internal setups.
NZD/USD Analysis [38:40]
The presenter analyses NZD/USD, noting that it is currently in an extreme POI for a sell. He highlights a trade currently running based on a one-minute extreme POI after a 15-minute break of structure to the downside. He explains the importance of adding one pip to the entry to avoid missing the trade. He notes that the pair is not completely bullish yet, but if it breaks structure to the upside, it will be possible to look for buys at the four-hour POI.
EUR/GBP and NAS Analysis [42:12]
The presenter analyses EUR/GBP, finding nothing of particular interest and describing it as boring. He notes that they are waiting to see if the pair breaks structure to the downside to confirm a bearish trend. For NAS, he identifies a new four-hour POI after a break of structure to the upside.
Recap and Q&A [43:44]
The presenter provides a quick recap of all the pairs analysed, highlighting key POIs and potential trading opportunities. He reminds viewers that the live streams are recorded and available on the For Traders YouTube channel. He then answers further questions from the audience, covering topics such as trading times, handling close high timeframe POIs, and the criteria for valid POIs.
Giveaway [54:48]
The presenter conducts a giveaway for a free $6,000 funded account. He asks a question related to the content of the live stream: "Are break of structures from a body closure to a wick, from a wick to a body closure, or from a body closure to another body closure?" The first person to provide the correct answer, "body to body closure," wins the funded account.