TLDR;
This video provides a comprehensive guide to trading candlestick patterns, emphasizing the importance of combining these patterns with key levels and areas of confluence to improve trade quality. It covers various candlestick patterns, entry methods, and the use of multi-time frames to confirm trend changes and avoid false signals. The video also addresses how to identify and avoid false reversals, and introduces the concept of "imperfect trades" within zones of multiple key levels.
- Candlestick patterns combined with key levels increase trade quality.
- Multi-time frame analysis helps confirm trend changes and improve entry points.
- Identifying and avoiding false reversals is crucial for successful trading.
- Imperfect trades in zones with multiple key levels require careful analysis and confirmation.
Candlestick Basics [1:46]
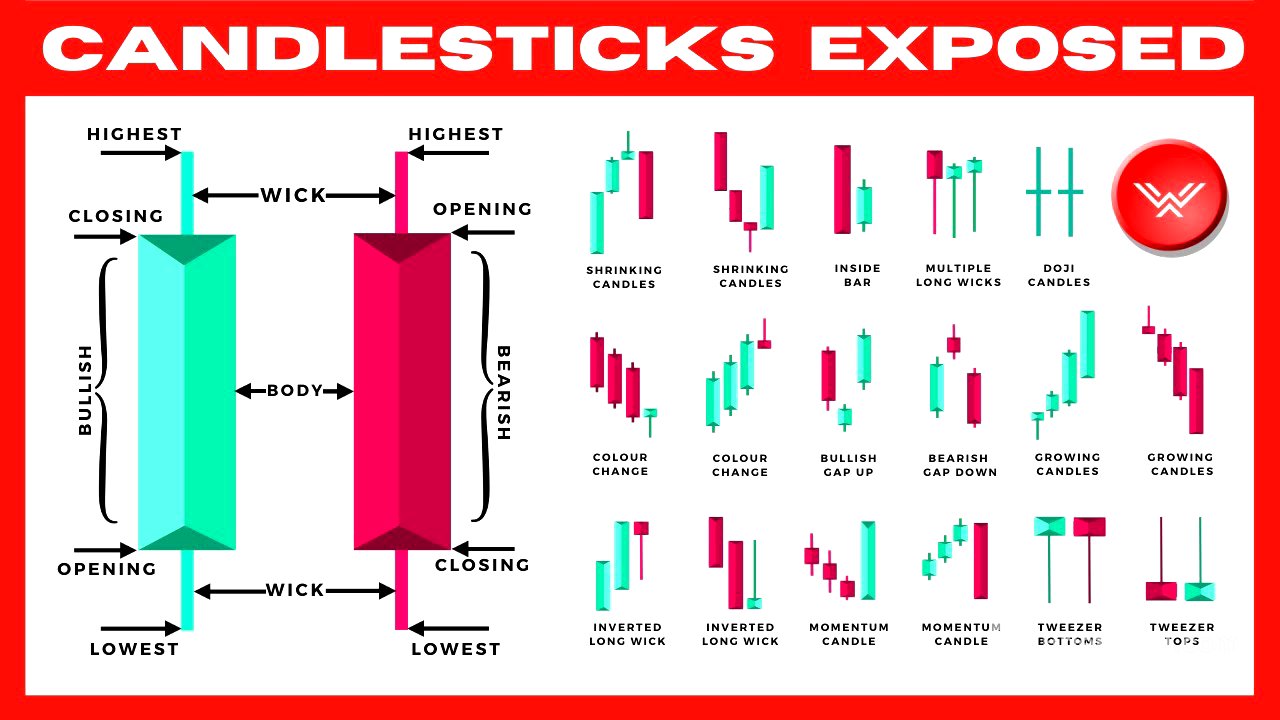
The chapter begins with a recap of candlestick basics, explaining how to read candlesticks, differentiating between bullish (green) and bearish (red) candles. For green candles, the opening price is at the bottom, and the closing price is at the top; for red candles, the opening price is at the top, and the closing price is at the bottom. The wicks represent the highest and lowest price points. Candlestick patterns act as leading indicators, revealing buying and selling dynamics in the market, which helps traders determine a directional bias.
Candlestick Patterns [3:43]
The video identifies several effective candlestick patterns, emphasizing their use in combination with key levels. These patterns include:
- Long Wick Candle: Indicates a potential reversal in the direction of the moving trend. The smaller the body and the longer the wick, the stronger the signal. In an uptrend, a long wick at resistance suggests buyers failed to maintain upward momentum, signaling a short opportunity. In a downtrend, a long wick at support suggests sellers failed to maintain downward momentum, signaling a long opportunity.
- Multiple Long Wick Candles: Clusters of long wick candles at key levels indicate repeated failed attempts to breach the level, reinforcing its validity. In an uptrend, multiple long wicks at resistance suggest strong selling pressure. In a downtrend, multiple long wicks at support suggest strong buying pressure.
- Inverted Long Wick Candle: The wick sticks out in the opposite direction of the moving trend. In an uptrend, an inverted long wick at resistance indicates strong selling presence. In a downtrend, an inverted long wick at support indicates strong buying presence.
- Inside Bar Candle: The high and low of the candle are contained within the high and low of the previous candle. In an uptrend, an inside bar at resistance shows a loss of momentum from buyers. In a downtrend, an inside bar at support shows a loss of momentum from sellers.
- Consecutive Shrinking Candles: Consecutive candles that decrease in size, indicating a loss of momentum. This pattern is most effective when combined with a reversal candlestick pattern at a key level. In an uptrend, shrinking candles signal weakening buying pressure. In a downtrend, shrinking candles signal weakening selling pressure.
- Candles Increasing in Size: Consecutive candles that increase in size, confirming the presence of heavy buying or selling pressure after a trade setup. In an uptrend, increasing bearish candles confirm heavy selling pressure. In a downtrend, increasing bullish candles confirm heavy buying pressure.
- Candle Color Change: Consecutive candles of one color followed by a candle of the opposite color. In an uptrend, consecutive green candles followed by a red candle signal a loss of buying momentum. In a downtrend, consecutive red candles followed by a green candle signal a loss of selling momentum.
- Momentum Candle: A candle with a body size much larger than the previous candle, representing a significant gain in momentum. In an uptrend, a bearish momentum candle confirms strong selling pressure. In a downtrend, a bullish momentum candle confirms strong buying pressure.
Entry Methods [18:13]
The video outlines several entry methods based on candlestick patterns and trend confirmations:
- Trend Trade in an Uptrend: Identify an uptrend with higher highs and higher lows. Look for confluence factors such as key support levels, moving averages, and Fibonacci levels. Wait for candlestick patterns to form at the area of confluence, then confirm the trend change with a momentum candle before entering a long trade.
- Trend Trade in a Downtrend: Identify a downtrend with lower highs and lower lows. Look for confluence at resistance levels. Wait for candlestick patterns to form, followed by a trend line break to confirm the reversal before entering a short trade.
- Reversal Trade in an Uptrend: Identify a key level of resistance. Look for shrinking candles as price approaches the level, followed by multiple long wick candles. Confirm the trend change with increasing bearish candles and a momentum candle breaking through the trend line before entering a short trade.
- Reversal Trade in a Downtrend: Identify a key level of support. Look for multiple long wick candles. Confirm the reversal with a break above the trend line before entering a long trade.
- Reversal Continuation Trade: This involves entering a trade after a reversal pattern has already formed and been confirmed. In an uptrend, this means entering a short trade after a double top has formed and the neckline has been broken. In a downtrend, it involves entering a long trade after a double bottom has formed and the neckline has been broken.
Multi-Time Frames [24:40]
The video explains how to use multi-time frame analysis to improve entry points and confirm trend changes. By looking at lower time frames, traders can find earlier signals of trend changes and enter trades at more favorable prices.
- Trend Trade in an Uptrend: After identifying candlestick patterns at an area of confluence on a higher time frame, switch to a lower time frame to find price action that signals a trend change from a downtrend to an uptrend, such as a double bottom or a trend line break.
- Trend Trade in a Downtrend: After identifying candlestick patterns at an area of confluence on a higher time frame, switch to a lower time frame to find price action that signals a trend change from an uptrend to a downtrend, such as a double top or a trend line break.
- Reversal Trade in Uptrend/Downtrend: Similar to trend trades, multi-time frame analysis helps in identifying precise entry points after candlestick patterns form at key levels.
False Candles and Reversals [33:51]
The video addresses the issue of false reversals, which occur when traders enter trades based solely on candlestick patterns without waiting for trend change confirmation. To avoid these traps, traders should always wait for price action that signals an actual reversal and identify a key entry point that maximizes gains and limits risk. Examples using Twitter and Coinbase stocks illustrate how descending triangle patterns can invalidate potential long setups.
Imperfect Trades [40:59]
The video introduces the concept of "imperfect trades," which occur when there are multiple key levels close together, creating a zone. Instead of drawing multiple levels, traders should draw a wide zone and look for candlestick patterns to form within or around this zone. The video emphasizes that candlestick patterns don't have to form exactly within the zone; they can form slightly past it as well. Examples using Bitcoin illustrate how to identify potential profit-taking areas based on monthly and weekly time frames. The video also notes that traders can choose to focus only on clear, distinct support and resistance levels if they prefer a more conservative approach.