TLDR;
This video explains how to trade using the 4-hour Power of Three, focusing on identifying accumulation, manipulation, and distribution (AMD) patterns using candle formations. It emphasizes waiting for the wick to form before trading the body of the candle and aligning entries with daily bias and lower time frame fractal models. The video provides multiple examples across different instruments and time frames to illustrate these concepts.
- Focus on trading the body after the wick formation.
- Align entries with daily bias and lower time frame fractal models.
- AMD patterns using candle formations.
Intro [0:00]
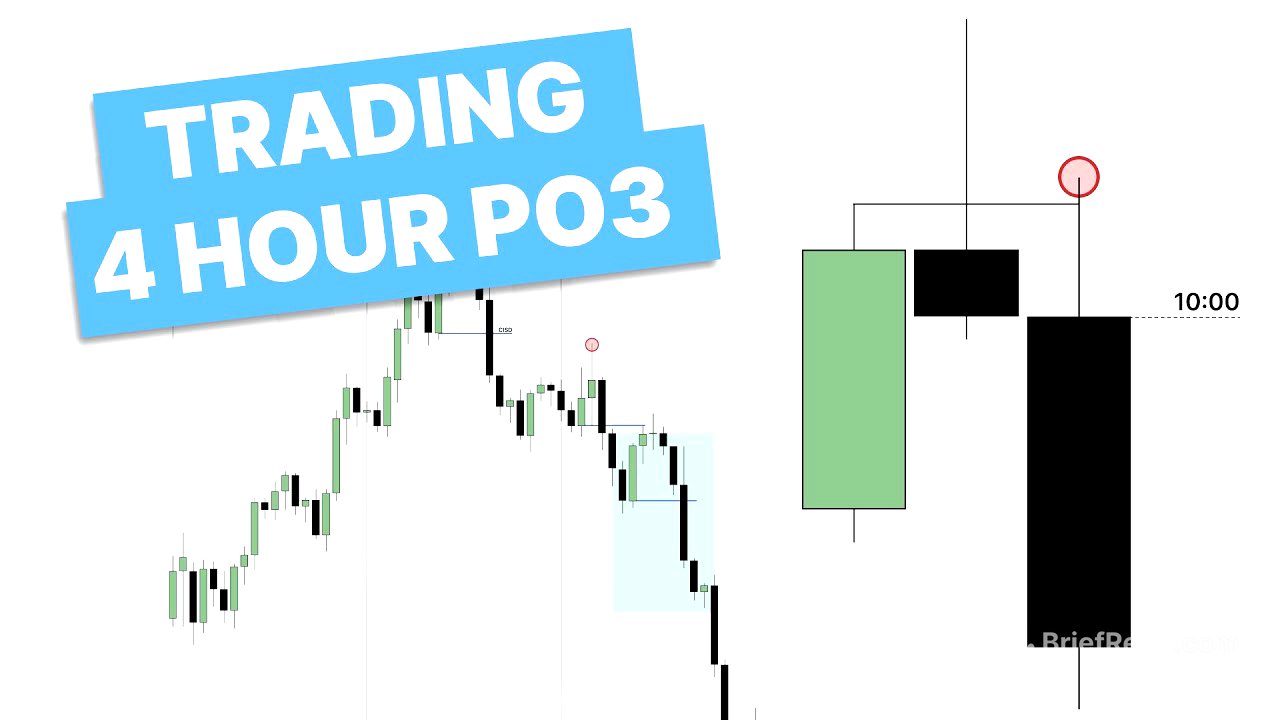
The video introduces the concept of trading the open, high, low, and close of a 4-hour candle, also known as the 4-hour Power of Three. It references previous videos on candle patterns, emphasizing that understanding those concepts is crucial for grasping the content of this video.
PDF [0:30]
The Power of Three, or AMD (Accumulation, Manipulation, Distribution), involves identifying a consolidation range followed by an opposing run and then trading the distribution or the real move. Accumulation occurs in the first candle, while the second candle indicates manipulation. The third candle represents distribution, which is the expansion candle to be traded. The goal is to trade the expansion candle by understanding its structure on lower time frames, waiting for the opposing wick to form, and ensuring it's a shallow wick to support expansion. Distribution candles can manifest in two scenarios: one where candle two has a large opposing run, and another where candle two has a small, shallow opposing run. A large opposing run in candle two does not support expansion in candle two, so one should wait for candle three. A small opposing run in candle two allows for trading the expansion within the same higher time frame candle. The key is to let the wick form and then trade the body, avoiding attempts to catch the wick, which often leads to being stopped out.
Example 1 [4:11]
The first example begins with a top-down analysis, starting from the daily timeframe to the 15-minute timeframe for entries. On the daily chart, Wednesday formed a reversal, and Thursday showed continuation, suggesting Friday would continue higher, respecting the EQ of the previous day's range. On the 15-minute timeframe, the 2:00 candle showed a reversal, marking accumulation and manipulation, with an expected distribution higher. The 4-hour candle had a large opposing run below the 22:00 candle's low, forming a reversal candle. The distribution was expected in candle three, between 6:00 a.m. and 10:00 a.m., with the formation of a protected swing. After a sweep of a low and a change in the state of delivery, a protected swing formed, indicating the wick had formed, allowing for a long entry with a stop loss at the low, targeting the previous day's high.
Example 2 [7:05]
The second example focuses on a forex trade with USD/JPY. The weekly timeframe shows a reversal candle, suggesting potential upward expansion. The analysis identifies expansion and retracement patterns, with failure swings on the high. A drop to the 15-minute timeframe is used to look for an entry, noting the different timings compared to futures. The strategy involves waiting for a reversal off the previous candle's low, with two possible scenarios: a shallow opposing run for trading within the same candle or a larger opposing run, requiring waiting for the next candle. After initial expansion higher without a confirmed reversal, a change in the state of delivery occurs, confirming the reversal. A continuation entry is sought after a short-term target is hit, using a protected swing as a stop loss, targeting a 2R profit. The trade aims to capitalize on the expansion candle's range within its limited timeframe, with consideration for waiting for the next higher timeframe candle for further continuation.
Example 3 [11:02]
The third example uses a 4-hour Power of Three strategy paired with a lower timeframe fractal model, referred to as GXT, combining Garrett's 4-hour profiling with a fractal model. A 2 a.m. reversal on London time for gold suggests a 6 a.m. continuation. The strategy involves waiting for price to open, make a high while respecting the EQ of the previous candle, and then trade lower, focusing on letting the wick form before trading the body. On a lower timeframe (3-minute or 5-minute), the strategy waits for a fractal model to align, looking for a consolidation, a run of the consolidation highs, and a change in the state of delivery to confirm the reversal. A positional entry can be taken at the open of the new higher timeframe candle, with a stop loss on the protected swing, targeting 2R, or waiting for a continuation.
Example 4 [14:58]
The fourth example analyzes NQ on the 5-minute timeframe, noting that price has swept out the previous day's high, with expansion met by expansion, forming a reversal. The 6 a.m. 4-hour candle shows a reversal, suggesting a 10:00 a.m. continuation lower. The strategy uses a lower timeframe fractal model, with an hourly and 5-minute model printing a T-spot. The approach involves waiting for price to open, form its wick, and then trade lower, avoiding trading above a certain area, using it as a stop loss. A positional entry is taken, positioning the stop loss in an area that would invalidate the trade if reached, targeting the negative one standard deviation.
Example 5 [16:36]
The final example integrates the 5-minute, hourly, and 4-hour timeframes to analyze price action. Initially, a bearish structure is observed with a candle 3 closure. After a V-shaped reversal, the focus shifts to trading towards failure swings on the high. A shallow wick off the previous low on the 4-hour chart supports expansion higher, anticipating a move at 10:00 a.m. SMT and CISD are noted, presenting an opportunity for a reversal entry with a stop on the body low, targeting the highs. Alternatively, a continuation entry is considered as the 10 a.m. candle opens, forming a shallow wick on both the 4-hour and hourly charts, supporting expansion. Multiple entry points are identified, including a consolidation, sweep, and a new protected swing, each offering a 2R opportunity. The example also illustrates how to identify a continuation 4-hour candle, aligning lower timeframe entries with the expected expansion.
Outro [20:54]
The video concludes by encouraging viewers to leave questions in the comment section and expresses hope that the content was helpful.