TLDR;
This stock market report from March 27th prepares viewers for the upcoming week, covering important levels, expected market moves, and sentiment indicators. It highlights the outperformance of energy stocks relative to the S&P 500, the impact of rising dollar and 10-year yield on the market, and the current state of volatility. The report also discusses potential bounce opportunities in oversold tech stocks and emphasizes the need for risk management amid market instability.
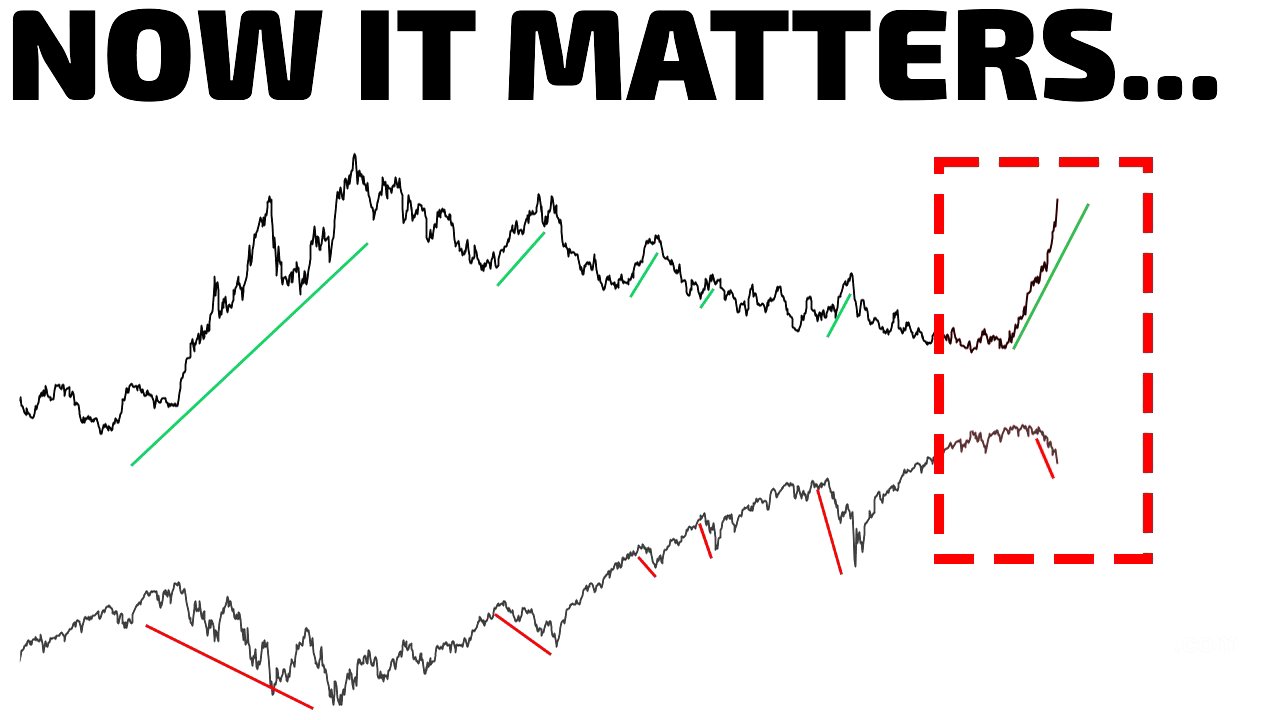
- Energy sector's outperformance and its inverse relationship with the S&P 500.
- Impact of rising dollar and 10-year yield on market downturn.
- Identification of potential bounce opportunities in oversold tech stocks like Meta and Microsoft.
- High volatility and negative gamma conditions, suggesting potential for wide market swings.
- Importance of risk management and adapting trading strategies to changing market conditions.
Sector Performance and Market Dynamics [0:40]
The energy sector has significantly outperformed all others, up 40% year-to-date, while communication services lagged. Historically, when energy outperforms the S&P 500, the S&P 500 tends to decline. Currently, energy's relative strength is nearing highs last seen in 2022-2023, with rotation occurring from financials into energy. Oil prices have been a key driver, rising 15-16% even before a significant spike, and typically, a rise in oil prices leads to a rise in the 10-year yield, putting pressure on bonds (TLT). Despite this, bonds have outperformed the S&P 500 since the February lows.
Correlations and Technical Indicators [2:45]
The dollar and 10-year yield have been rising, creating a negative correlation with the S&P 500. The S&P 500's weekly MACD shows a significant downturn, reminiscent of conditions before a volatile period in April. An indicator designed to identify trend changes has been red since September 2025, recently falling back to those levels. The market has gone three weeks without hitting the weekly implied move, a rare occurrence. The S&P 500 has reached its quarter-to-date implied move, prompting the speaker to re-enter the market with controlled exposure.
Key S&P 500 Levels and Volatility [5:09]
The S&P 500 is currently below its month-to-date implied move, reflecting heightened volatility and geopolitical risks. Realized volatility is now matching implied volatility, indicating significant market movement. Key levels to watch include the quarter-to-date implied move and the JPM collar. The year-to-date implied move sets boundaries at 8,000 on the upside and approximately 5700 on the downside. A drop to these levels, 15% away, could present buying opportunities.
Magnificent Seven Performance and Potential Bounce Plays [6:28]
Google, Microsoft, and Meta experienced moves beyond two standard deviations, driving the recent sell-off, which appeared algorithmic rather than driven by capitulation. Year-to-date, Microsoft is down 26%, while Meta and Tesla are each down about 20%. Despite this poor performance, the tech sector isn't yet oversold according to the bullish percent index. The speaker is watching Meta for a potential bounce and has initiated a small position in Microsoft, employing a strategy of fading trends with quick exits.
Sentiment Indicators and Market Breadth [9:05]
The sentiment index is at 13.4, a low not seen since April, but shows a subtle bullish divergence. The bullish percent index for the S&P 500 is approaching a level where a bullish divergence could form. The NASDAQ composite's bullish percent index continues to decline, but the technology sector remains out of oversold territory. Market breadth is deteriorating, with only 13% of S&P 500 stocks above their 20-day moving average.
Bottom Fishing Indicators and Gamma Exposure [10:47]
The NASDAQ record high percent index, used as a bottom fishing indicator, requires a close under 20 followed by a move back above 35 to signal a potential bottom. The "old fool indicator," based on the NASDAQ composite and put-to-call ratio, had a bearish crossover in February. The market is currently in deeply negative gamma territory, the lowest since July 2025, which often precedes a bounce. Volatility is at 31%, the highest closing print of the year, and the VIX futures curve is in backwardation, indicating current market stress.
Volatility Dynamics and Systematic Positioning [12:58]
The VIX futures curve is in backwardation, signaling immediate market concerns. The volatility of the volatility index is elevated at 133, suggesting potential for wide market swings. Back month versus front month volatility is extended, indicating possible market stabilization and bounce. Systematic positioning indexes are in oversold conditions, with CTAs contributing to the sell-side pressure. Bond market volatility remains high, necessitating caution.
Expected Market Moves and Risk Management [15:16]
The shortened trading week has a weekly implied move of $19 on the S&P 500 and $9 on the SPY, potentially bringing the market back to its month-to-date expected move. The recent sell-side activity appeared algorithmic, emphasizing the importance of watching for trend breaks. The daily implied moves are 645 to the upside and 623 to the downside. The market tagged its quarter-to-date level at 6399. Despite potential rallies, the market has not fully proven itself, underscoring the need for continued risk management.