TLDR;
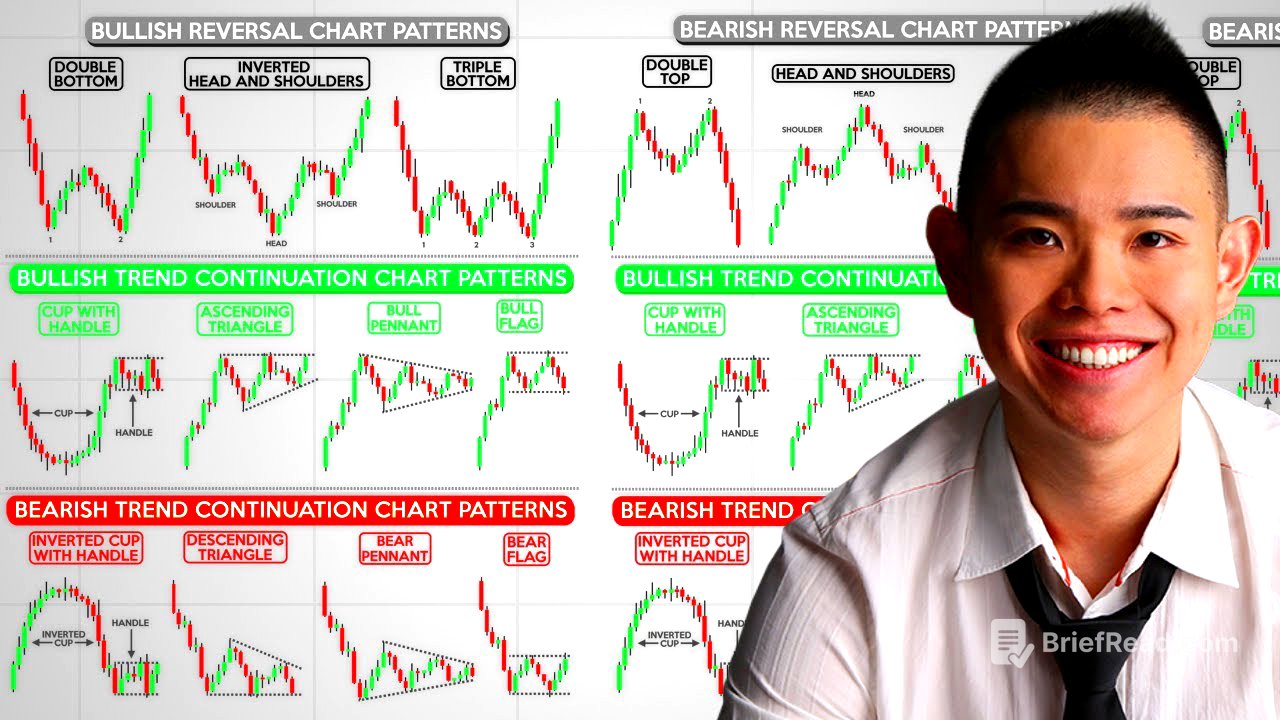
This video serves as a comprehensive course on chart patterns trading, suitable for both beginners and advanced traders across various markets like stocks, forex, and crypto. It aims to teach viewers how to use chart patterns to time entries and exits, predict market turning points, and develop profitable strategies for both bull and bear markets. The course covers a range of chart patterns, including double tops and bottoms, head and shoulders, triple tops and bottoms, cup and handle patterns, and ascending and descending triangles, along with practical trading strategies.
- Introduces key chart patterns for timing entries/exits.
- Explains how to predict market turning points.
- Provides strategies for profiting in both bull and bear markets.
Double Top Pattern [1:26]
The double top pattern is a bearish reversal pattern that forms after an uptrend. It consists of two peaks at roughly the same price level, with a pullback in between. A neckline is drawn connecting the lows of the pullback. The pattern is confirmed when the price breaks below this neckline, signaling a potential downtrend. A common mistake is to short immediately after the price breaks the neckline, which can lead to false breakouts. A better approach is to wait for the price to break the neckline and then retest it, looking for bearish entry triggers like a shooting star pattern.
Double Bottom Pattern [4:05]
The double bottom pattern is a bullish reversal pattern that occurs after a downtrend. It features two troughs at approximately the same level, with a rally in between. A neckline is drawn across the peaks of the rally. The pattern is confirmed when the price breaks above the neckline, indicating a potential uptrend. Similar to the double top, traders should avoid blindly trusting the breakout. Instead, wait for a break above the neckline and a subsequent retest of the previous resistance, which may now act as support, before looking for bullish entry signals like a hammer.
Head and Shoulders Pattern [6:13]
The Head and Shoulders pattern is a bearish reversal pattern characterized by a left shoulder, a head (the highest peak), and a right shoulder, followed by a neckline connecting the lows between these peaks. The pattern suggests a weakening uptrend, especially if the right shoulder fails to reach the height of the head. The pattern is confirmed when the price breaks below the neckline, signaling a potential downtrend. Avoid shorting immediately after the neckline break due to the wide stop-loss. A better strategy is to wait for the first pullback after the breakdown, looking for a bearish flag pattern to form, and then short when the price breaks below the low of this flag.
Inverse Head and Shoulders Pattern [10:04]
The inverse Head and Shoulders pattern is the bullish counterpart to the Head and Shoulders pattern. It appears after a downtrend and consists of a left shoulder, a head (the lowest trough), and a right shoulder, with a neckline connecting the highs between the peaks. The pattern suggests a potential reversal to an uptrend, confirmed when the price breaks above the neckline. Classical technicians use price projections to estimate where the price could terminate, calculating the distance from the head to the neckline and projecting it upwards from the neckline. A tradable breakout occurs when the market consolidates just before the area of resistance, allowing for a tighter stop loss.
Triple Top Pattern [15:12]
The triple top pattern is a bearish reversal pattern, a variation of the double top and Head and Shoulders patterns. It involves the price testing a high three times without breaking through, followed by a break below the neckline. The price projection principle can be applied here as well, using the distance from the highs to the neckline to project a potential termination point. Avoid shorting immediately after the neckline break due to the wide stop loss. Instead, wait for a break and retest, looking for a shooting star pattern.
Triple Bottom Pattern [18:56]
The triple bottom pattern is a bullish reversal pattern where the price makes three attempts to break below a support level but fails. This indicates strong buying pressure and a potential trend reversal. The pattern is confirmed when the price breaks above the neckline. To trade this pattern, wait for the price to break above the neckline and then look for a pullback and consolidation, identifying a flag pattern. Enter long when the price breaks above the high of the flag, setting a stop loss below the lows.
Cup and Handle Pattern [21:45]
The cup and handle pattern is a bullish trend continuation pattern. It starts with an uptrend, followed by a rounded pullback (the cup) and a smaller consolidation (the handle). The handle represents a period of equilibrium between buyers and sellers. To trade this pattern, look for a breakout above the high of the handle, setting a stop loss below the swing low of the handle.
Inverted Cup and Handle Pattern [24:54]
The inverted cup and handle pattern is the bearish version of the cup and handle, indicating a bearish trend continuation. It occurs in a downtrend, with a longer pullback forming the inverted cup, followed by a weak rally forming the handle. The pattern is traded by looking for a break below the low of the handle, using the tight consolidation to set a stop loss above the high of the handle.
Ascending Triangle Pattern [27:19]
The ascending triangle pattern is a bullish trend continuation pattern characterized by a rising series of higher lows into a horizontal resistance level. This pattern indicates that buyers are becoming more aggressive, willing to buy at higher prices even in front of resistance. To trade this pattern, look for a breakout above the resistance level, or wait for a retest of the previous resistance, which may now act as support, looking for a hammer candlestick pattern.
Descending Triangle Pattern [32:48]
The descending triangle pattern is a bearish trend continuation pattern, the inverse of the ascending triangle. It features a series of lower highs into a horizontal support level, indicating increasing selling pressure. To trade this pattern, look for a break below the support level, using techniques like break and retest or the first pullback.
Bullish Pennant Pattern [35:35]
The bullish pennant is a bullish trend continuation pattern that forms after a strong uptrend. It is characterized by converging trend lines, creating a small symmetrical triangle. This pattern indicates a period of consolidation before the uptrend resumes. To trade this pattern, look for a breakout above the downward trend line, setting a stop loss below the recent swing low.
Bull Flag Pattern [39:54]
The bull flag pattern is another bullish trend continuation pattern, similar to the bullish pennant. However, instead of converging trend lines, the bull flag features two parallel lines, with a series of lower highs and lower lows. To trade this pattern, look for a breakout above the high of the flag, setting a stop loss below the low of the flag.
Bearish Pennant Pattern [44:03]
The bearish pennant is a bearish trend continuation pattern, the opposite of the bullish pennant. It forms after a downtrend and is characterized by converging trend lines, creating a small symmetrical triangle. To trade this pattern, look for a break below the upward trend line.
Double Top False Break Strategy [46:32]
This strategy involves identifying a double top pattern within a downtrend on a higher timeframe (e.g., daily). Look for the pattern to form at an area of resistance. On a lower timeframe (e.g., 8-hour), watch for bearish price rejection, such as a shooting star pattern, at the second top. Enter short on the next candle open, setting a stop loss above the high of the shooting star, using the Average True Range (ATR) to determine the distance. Set the first target at the neckline of the double top and a secondary target at a further swing low.
Break and Retest on Inverse Head and Shoulders Pattern [52:51]
This strategy involves identifying an inverse Head and Shoulders pattern on a daily timeframe, leaning against a higher timeframe (e.g., weekly) support level. On a lower timeframe (e.g., 8-hour), wait for the price to break above the neckline and then retest the previous resistance, which may now act as support. Look for a false break, where the price briefly breaks below the support before reversing and closing back above it. Enter long on the next candle open, setting a stop loss below the low of the false break, using the ATR. Set the first target just before the recent swing high. Use price projection techniques, such as the trend-based Fibonacci extension, to determine a secondary target.
Trend Reversal Breakout Trading Strategy [59:56]
This strategy involves identifying a market in a downtrend that enters a range at a key area of support on a higher timeframe. Look for an ascending triangle pattern to form within the range, requiring at least 80 candles to form. Trade the breakout above the resistance level of the ascending triangle, placing a buy stop order above the recent swing high. Set a stop loss below the previous swing low. Use a trailing stop loss, such as a 50-period moving average, to ride the trend up higher.
Head and Shoulders Pattern with Build-Up [1:07:28]
This strategy involves identifying a Head and Shoulders pattern where the price has already broken below the neckline. Instead of shorting immediately, wait for the 20-period moving average to catch up with the price, forming a build-up or bare flag pattern. This indicates decreasing volatility. Enter short when the price breaks below the low of the build-up, setting a stop loss a distance above the high of the build-up. Use the price projection technique, such as the trend-based Fibonacci extension, to determine a target.
Double Top Pattern at Resistance [1:13:04]
This strategy involves identifying a market in a downtrend approaching an area of resistance on a higher timeframe. On a lower timeframe (e.g., 4-hour), look for a double top pattern to form at the resistance level. Enter short on the next candle open after a bearish reversal signal, such as a false break. Set a stop loss a distance above the highs and a first target just before the recent swing low.