TLDR;
This video explains how to identify and trade supply and demand levels using volume profiles. It emphasizes that markets operate as auctions between buyers and sellers, and that understanding volume is key to finding high-probability trading opportunities. The video introduces two types of volume profiles (visible range and session) and explains how to use points of control (POCs) and high volume nodes to draw accurate supply and demand levels.
- Markets operate as auctions between buyers and sellers.
- Volume highlights important levels.
- Use volume profiles to identify POCs and high volume nodes.
- Look for clusters of POCs, high volume nodes, and price rejections to draw supply/demand levels.
What is a supply/demand level? [0:15]
Supply and demand levels are the driving forces behind market movements. Identifying these levels allows traders to predict market direction and potential reversals, providing a significant trading advantage. The market is essentially a constant auction between buyers and sellers aiming for a fair price. Price increases when buyers are willing to pay more, and decreases when sellers are willing to sell for less. Maintaining a neutral perspective is crucial for objective market analysis and consistent profitability.
How to trade supply/demand levels [1:25]
Trading based on supply and demand involves identifying areas on the chart with high buying and selling pressure, where large buyers and sellers are likely to act, creating tradable moves. Volume is essential for market movement; without it, there is no significant price change. Volume highlights the levels that the market deems most important. Price typically hovers around key levels until one side becomes more aggressive and initiates a breakout. Supply and demand levels are essentially accumulation and distribution zones that precede large market movements, aligning with Wyckoff distribution principles.
The volume profile [3:11]
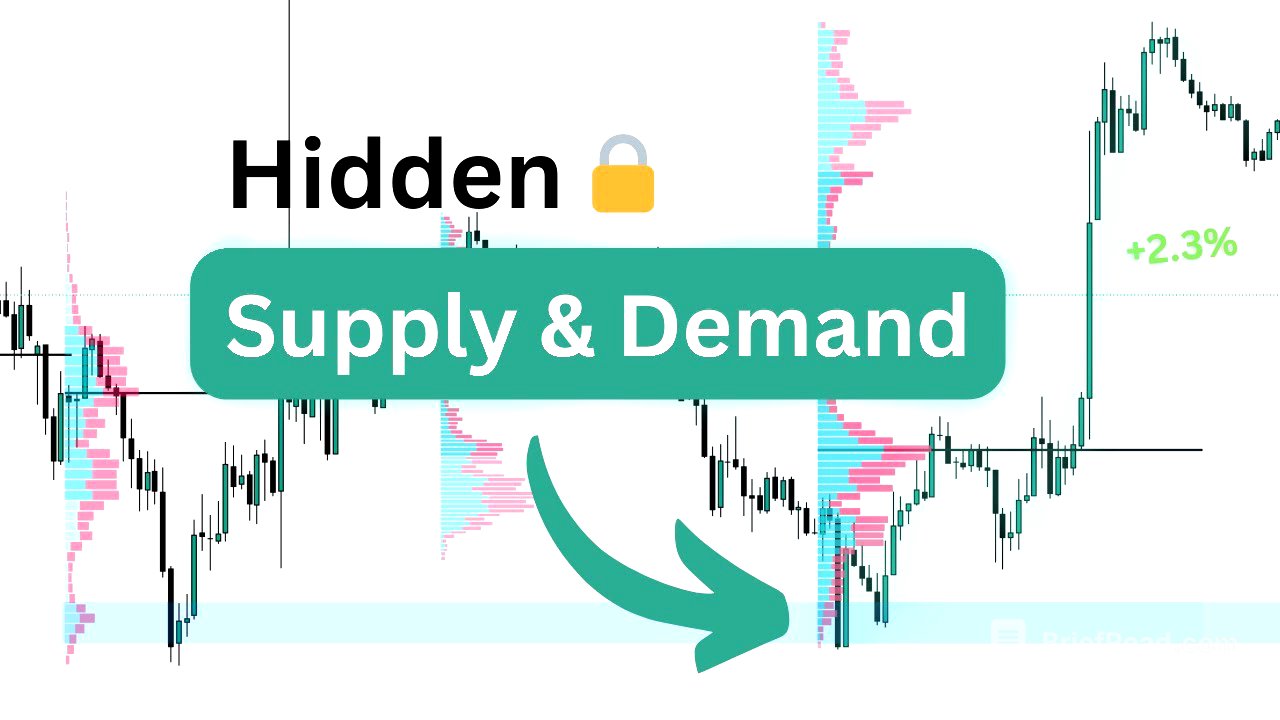
To find supply and demand levels, apply volume profiles to the chart. The volume profile shows how much trading activity occurred at each price level, indicating where buyers and sellers are most active. Use the visible range volume profile (VRVP) and the session volume profile (SVP). In TradingView, add the VRVP indicator and set the row size to 200. Then, add the SVP indicator and set the row size to 100. The point of control (POC) is the level with the highest traded volume for a session and acts as a price magnet. High volume nodes are large volume bars on the visible range profile, indicating significant trading activity.
Drawing the supply/demand levels [5:09]
To draw supply and demand levels, look for areas with multiple POCs clustered together and coinciding with a high volume node. Ideally, there should also be strong price rejections from that area on both sides. Center the level around the highest volume point, with edges where the volume drops off sharply. Unlike other traders who focus on price action patterns, this method prioritizes high volume to identify strong and reliable levels. The market reveals its intended direction through these levels, which can remain relevant for extended periods. The price reacts to these levels with high accuracy because it gravitates towards areas of high volume.