TLDR;
This video introduces the "ladder of life" concept in trading, which involves identifying patterns of ascending, descending, and horizontal staircases on lower time frames to anticipate price direction changes and improve entry points. It complements existing trading methods by providing insights into potential breakouts, reversals, and the validity of support and resistance zones. The video uses real chart examples to illustrate how to apply this concept to various trading strategies, including support and resistance, supply and demand, and engulfing patterns.
- The ladder of life consists of ascending, descending, and horizontal staircases, reflecting price movements.
- Identifying these staircases on lower time frames (M15, M5, M1) helps anticipate price direction changes.
- The ladder of life concept can be applied to various trading strategies, including support and resistance, supply and demand, and engulfing patterns.
Introduction to the Ladder of Life [0:00]
The video introduces the concept of the "ladder of life" as a complementary tool for traders, regardless of their preferred methods. This concept enhances the understanding of price movements near resistance and support levels, as well as breakout points. The core idea revolves around recognizing three types of ladders or staircases in price charts: ascending, descending, and horizontal, each indicating different market structures and potential directional changes.
Understanding the Three Types of Ladders [0:51]
The "ladder of life" concept identifies three distinct types of staircases in price movements: ascending, descending, and horizontal. An ascending staircase is characterized by higher supports and resistances, indicating an upward trend. Conversely, a descending staircase features lower supports and resistances, signaling a downward trend. A horizontal staircase shows resistance and support at the same level, suggesting consolidation. Recognizing these structures is crucial for anticipating potential direction changes and breakouts.
The Function and Importance of the Ladder of Life [2:05]
The primary function of the "ladder of life" is to identify potential changes in price direction, such as reversals or breakouts. By observing these ladder patterns, traders can anticipate whether a price will reverse, break through a level, or change direction. This concept is particularly useful when combined with higher time frame analysis to refine entry points on lower time frames like M15, M5, and M1.
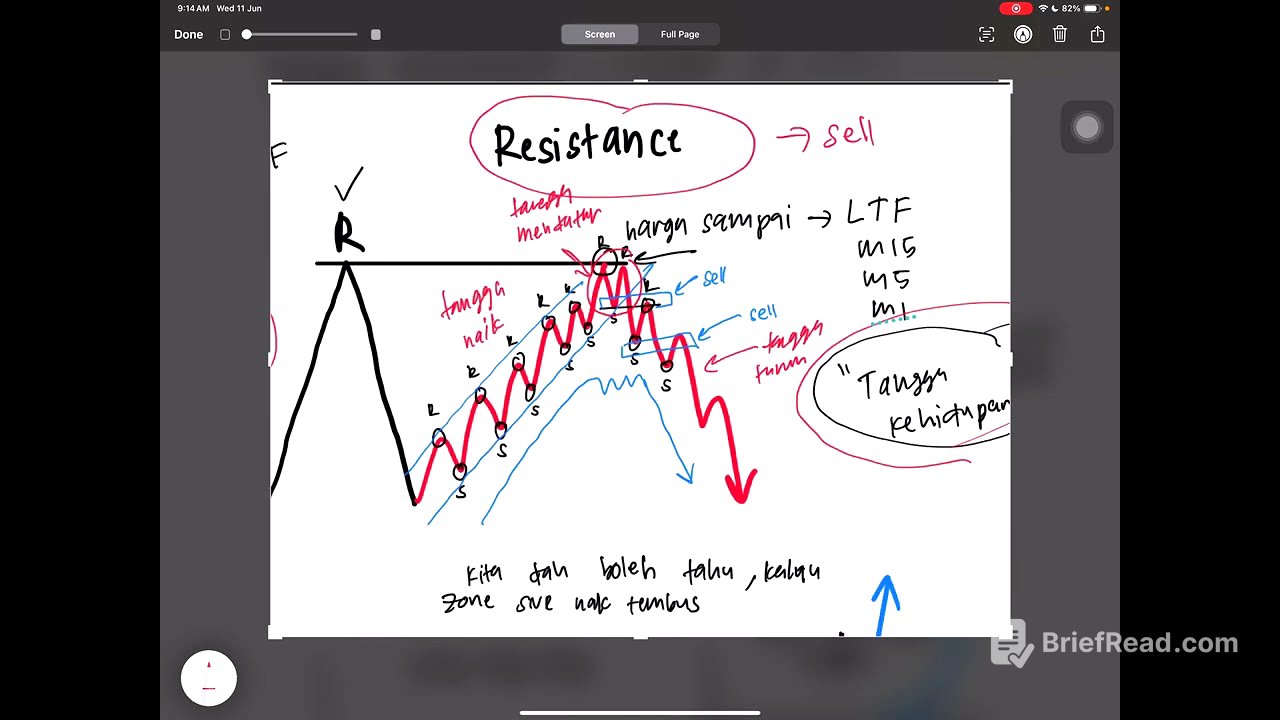
Applying the Ladder of Life to Resistance and Support [4:15]
To apply the "ladder of life" to resistance and support, first identify these zones on higher time frames like H1 or H4. Then, drop to lower time frames (M15, M5, or M1) to observe the ladder patterns forming near these zones. A change in the ladder, such as a transition from ascending to descending near a resistance zone, signals a potential sell entry. Conversely, a shift from descending to ascending near a support zone indicates a possible buy entry.
Determining Breakouts Using the Ladder of Life [8:07]
The "ladder of life" can also help determine whether a resistance or support zone is likely to be broken. If the ladder fails to create lower lows near a resistance zone, it suggests the resistance will likely be breached. In such cases, traders should look for breakout zones on lower time frames to enter buy positions. Conversely, if the ladder fails to create higher highs near a support zone, a breakout is imminent, and traders should prepare to sell.
Ladder of Life for Supply and Demand [13:23]
When applying the "ladder of life" to supply and demand zones, look for signs of changing staircases. For example, if a price is expected to drop from a supply zone (drop base drop), observe the ladder on lower time frames. A shift from ascending to horizontal and then descending indicates a potential sell entry. Conversely, for a rally base rally, a transition from descending to horizontal and then ascending suggests a buy entry.
Ladder of Life for Drop Base Drop and Rally Base Rally [15:01]
To use the "ladder of life" with drop base drop setups, confirm the price is in a supply zone and then look for a change in the ladder from ascending to descending on lower time frames. This indicates a potential sell entry. For rally base rally setups, ensure the price is in a demand zone and watch for the ladder to shift from descending to ascending, signaling a buy entry.
Ladder of Life to Identify Failures in Drop Base Drop and Rally Base Rally [17:39]
To identify failures in drop base drop setups, look for the ladder to create higher highs, indicating the price is likely to break through the supply zone. In such cases, look for SBR (Support Becomes Resistance) or RBS (Resistance Becomes Support) breakouts to enter buy positions. For rally base rally failures, observe the ladder forming lower lows, suggesting the price will break through the demand zone. Look for breakout zones to enter sell positions.
Ladder of Life for Engulfing Patterns [20:17]
When trading bearish engulfing patterns, confirm the pattern on a higher time frame and then look for a descending ladder on lower time frames to validate a sell entry. If the ladder is still ascending, the trade is risky. For bullish engulfing patterns, look for an ascending ladder on lower time frames to confirm a buy entry.
Ladder of Life to Identify Failures in Engulfing Patterns [24:08]
To identify failures in bearish engulfing patterns, look for the ladder to create higher highs, indicating the price is likely to break through the bearish engulfing zone. In such cases, look for breakout areas to enter buy positions. For bullish engulfing failures, observe the ladder forming lower lows, suggesting the price will break through the bullish engulfing zone. Look for breakout zones to enter sell positions.
Chart Examples: Bullish Engulfing [26:50]
The video provides a chart example of a bullish engulfing pattern on the H1 time frame. After the price arrives at the bullish engulfing zone, the trader switches to the M5 time frame to observe the ladder of life. The example shows the ladder transitioning from descending to leveling off and then rising, indicating a potential buy entry near the breakout area.
Chart Examples: H1 Support Zone [31:26]
The video presents a second chart example focusing on an H1 support zone. The trader looks for the ladder of life on the M5 time frame to determine potential buy entries. The example illustrates how the ladder pattern helps identify areas where the price is likely to move upward, providing entry points for buy positions.
Chart Examples: Resistance Breakout Become Support (RBS) [33:55]
The video demonstrates an example of RBS, where resistance becomes support. The trader emphasizes the importance of focusing on the ladder of life to identify entry points. By switching to the M5 and M1 time frames, the trader shows how the ladder pattern helps in layering entries to maximize profits.
Chart Examples: Bullish Engulfing H1 [38:13]
The video provides another chart example, this time focusing on a bullish engulfing pattern on the H1 time frame. The trader switches to the M5 time frame to observe the ladder of life, identifying resistance and support levels. The example shows how the ladder pattern helps in identifying potential buy entries after a breakout.
Chart Examples: H1 Resistance [40:41]
The video presents a chart example of an H1 resistance level. The trader switches to the M5 time frame to observe the ladder of life, identifying potential sell entries. The example illustrates how the ladder pattern helps in determining whether the resistance level will hold or break, guiding the trader's decision to enter a sell position.
Chart Examples: H1 Support Zone - Ladder of Life [47:35]
The video concludes with an example of an H1 support zone. The trader explains that simply being in a support zone is not enough to warrant a buy entry. Instead, the trader looks at the ladder of life on the M5 time frame to see if a new staircase is forming. The example shows how the ladder pattern helps in avoiding false buy signals and identifying potential sell entries even near a support zone.


![[GOOVER] User's Guide 1. Good answers from good questions](https://wm-img.halpindev.com/p-briefread_c-10_b-10/urlb/aHR0cDovL2ltZy55b3V0dWJlLmNvbS92aS96LThUeFc3OTFlYy9ocWRlZmF1bHQuanBn.jpg)