TLDR;
This video provides a comprehensive guide to understanding and utilizing the stochastic indicator in trading. It covers the basics, calculation, settings, and relationship with other indicators like RSI. It also discusses the limitations, common mistakes, and various trading strategies associated with the stochastic oscillator, including breakout, trend-following, and range trading. Additionally, it explores the stochastic RSI and ways to combine stochastics with other tools for improved trading decisions.
- The stochastic indicator measures the momentum of price, not price or volume directly.
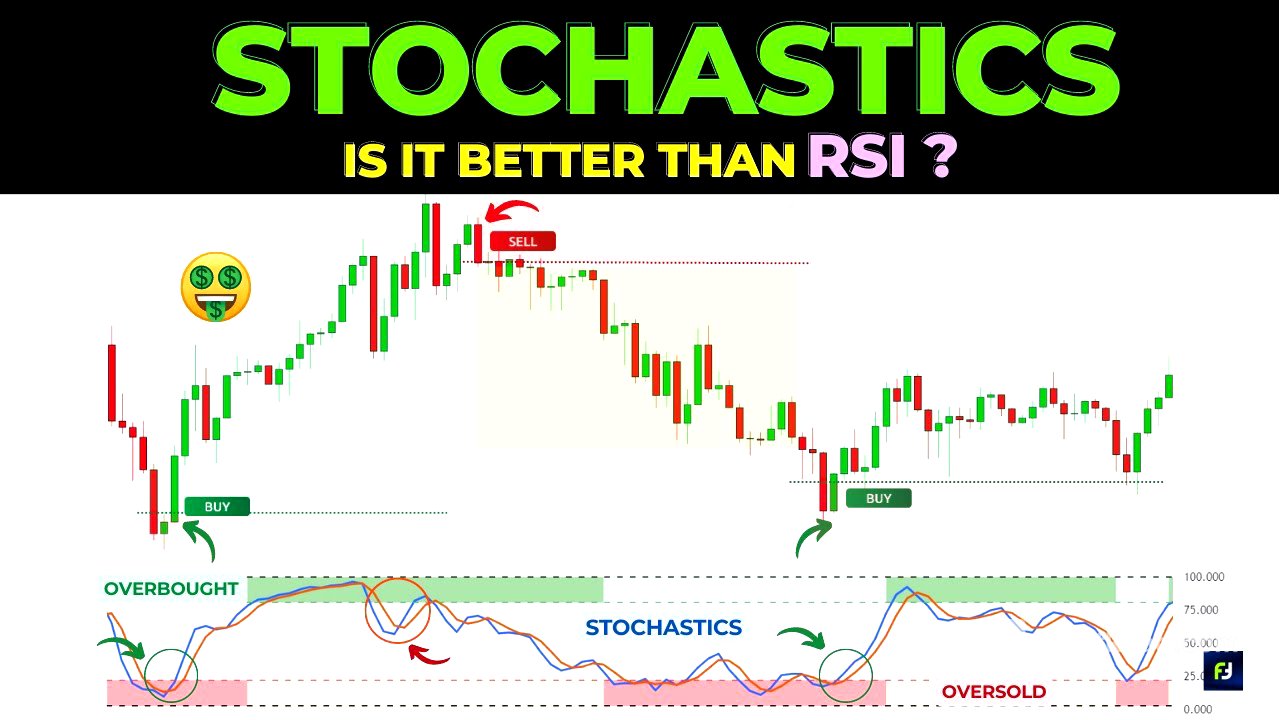
- It oscillates between 0 and 100, with overbought levels typically above 80 and oversold below 20.
- The indicator can be used to identify potential buying or selling opportunities, but should be combined with other indicators and analysis for confirmation.
Introduction to Stochastic Indicator [0:05]
The video introduces the stochastic indicator as a popular technical analysis tool that helps traders understand trend dynamics and improve chart analysis. It emphasizes the importance of understanding and using the indicator correctly to avoid bad trading decisions. The video will cover the basics of stochastics, its calculation, general settings, relationship with RSI, limitations, stochastic RSI, uses, trading strategies, and ways to combine it with other tools.
Basics of Stochastic Oscillator [2:04]
The stochastic oscillator was developed by Dr. George C. Lane in the 1950s. Unlike traditional indicators that follow price or volume, the stochastic indicator follows the momentum of price. Momentum is the rate of acceleration of the price of a security. The stochastic oscillator compares a specific closing price of an asset with a range of high and low prices over a given period, typically 14 periods. The value of the stochastic indicator always stays between 0 and 100.
Stochastic Indicator Calculation [4:16]
The default setting for the stochastic oscillator is 14 periods, which can be adjusted. The sensitivity of the indicator is controlled by percentage K and percentage D. Percentage K uses the most recent close price, the highest high, and the lowest low over the last 14 periods. Percentage D is a three-period simple moving average of percentage K and acts as a signal line. The formulas for calculation are: Percentage K = (CP - L14) * 100 / (H14 - L14), where CP is the most recent closing price, L14 is the lowest trading price in the previous 14 periods, and H14 is the highest trading price in the previous 14 periods. Percentage D is the three-period simple moving average of the percentage K line.
Understanding High and Low Stochastic Numbers [7:34]
A high stochastic number means the price closed near the top of the range over a certain period. For example, if the high is at 110.61, the lowest low is at 108.76, and the most recent close is at 110.21, the stochastic value is calculated to be 79.5. A low stochastic value indicates that the momentum to the downside is strong, with the current close relatively close to the absolute low. For instance, a stochastic indicator showing 13.5 percentage means the price is just 13.5 percentage away from the lowest low.
Types of Stochastic Indicators [10:31]
There are three versions of stochastic oscillators: fast, slow, and full. The fast stochastic oscillator is based on the original formula for percentage K and percentage D, but the percentage K line can be choppy. The slow stochastic oscillator smooths percentage K with a three-period simple moving average, making it less choppy. The full stochastic oscillator is a customizable version of the slow stochastic oscillator, allowing adjustments to the look-back period and moving averages.
Leading vs Lagging Indicator [13:32]
Stochastics is considered a lagging indicator, unlike RSI, which is a leading indicator. A lagging indicator follows price action and gives signals after the price has already moved. Stochastics is based on historical data and is calculated using the closing prices of an asset over the recent 14 periods. It is slow to react to market conditions and identify turning points. However, it can be useful for confirming signals generated by leading indicators and identifying trends.
Relationship Between Stochastic Oscillator and RSI [15:18]
Both stochastic oscillator and RSI are price momentum oscillators. The stochastic oscillator works on the theory that the price of an asset tends to close near its high during market uptrends and close near its low during market downtrends. RSI measures the velocity at which the price of an asset moves. RSI is useful in trending markets, while the stochastic indicator is more useful in sideways or choppy markets.
Uses of Stochastic Oscillator [18:11]
The main uses of the stochastic oscillator include identifying overbought and oversold levels, bullish and bearish divergences, and bullish and bearish setups. Overbought conditions occur when the closing price of an asset has been consistently high, while oversold conditions occur when the closing price has been consistently low. These levels can be used as potential signals to buy or sell an asset or as an indication of a trend reversal or continuation.
Bullish and Bearish Divergences [22:34]
Divergences form when a new high or low in price is not confirmed by the indicator. A bullish divergence forms when the price records a lower low, but the stochastic oscillator forms a higher low, indicating decreasing downside momentum. A bearish divergence forms when the price records a higher high, but the stochastic oscillator forms a lower high, indicating decreasing upside momentum. These divergences can indicate potential trend reversals.
Bullish and Bearish Setups [26:26]
A bullish setup occurs when the stochastic oscillator is in the oversold territory and then crosses above the 20 level, indicating a potential upward trend. A bearish setup occurs when the stochastic oscillator is in the overbought territory and then crosses below the 80 level, indicating a potential downward trend. These setups can be used to identify potential buying or selling opportunities, but should be confirmed with other indicators and price action.
Common Mistakes When Using Stochastic Indicator [27:51]
Common mistakes include going long just because the market is oversold or shorting just because the market is overbought, ignoring the market trend, thinking that the market will reverse just because a divergence is spotted, not considering the volatility in the asset, and not using confluences or considering other indicators. It's important to use the stochastic indicator in conjunction with other tools and analysis.
Stochastic RSI [31:55]
Stochastic RSI combines the concepts of the stochastic oscillator and RSI. It uses RSI as its base instead of price, making it more sensitive to momentum changes. Advantages include combining the strengths of both indicators, greater sensitivity, and better identification of divergences. Limitations include false signals, lagging nature, subjective interpretation, and susceptibility to market manipulations.
Trading Strategies with Stochastics [35:38]
Common trading strategies include identifying breakout signals, trend-following signals, multi-time frame signals, and range and reversal trading strategies. For breakout trading, look for the stochastic to accelerate in one direction with widening lines, signaling a new trend. For trend-following, use a combination of the 200-period simple moving average and stochastic to predict market turning points. Multi-time frame analysis involves aligning lower time frame trades with higher time frame trends. Range trading involves waiting for overbought or oversold conditions before shorting from resistance or longing from support.
Combining Stochastics with Other Tools [44:33]
To improve the quality of trades, combine the stochastic indicator with other tools such as moving averages, price patterns, and trend lines. Moving averages can act as filters for trades, while price patterns can signal potential breakouts. Trend lines can be used to confirm stochastic divergences or reversals. It is essential to fully understand the indicators and tools being used and to backtest and apply them to new trades.