TLDR;
This video compares three NASDAQ 100 covered call funds: JEPQ, GPIQ, and QQQI, analyzing their distribution histories, total returns, and key differences. It also discusses competitors like QYLD and QDVO. The speaker shares their take on these funds, revealing a shift from JEPQ to QQQI due to transparency and tax efficiency.
- JEPQ's performance lagged behind GPIQ and QQQI due to its opaque ELN-based covered call strategy.
- QQQI stands out for its transparency, tax efficiency (high return of capital), and consistent distributions.
- GPIQ offers a slightly lower expense ratio but less transparency compared to QQQI.
Introduction [0:00]
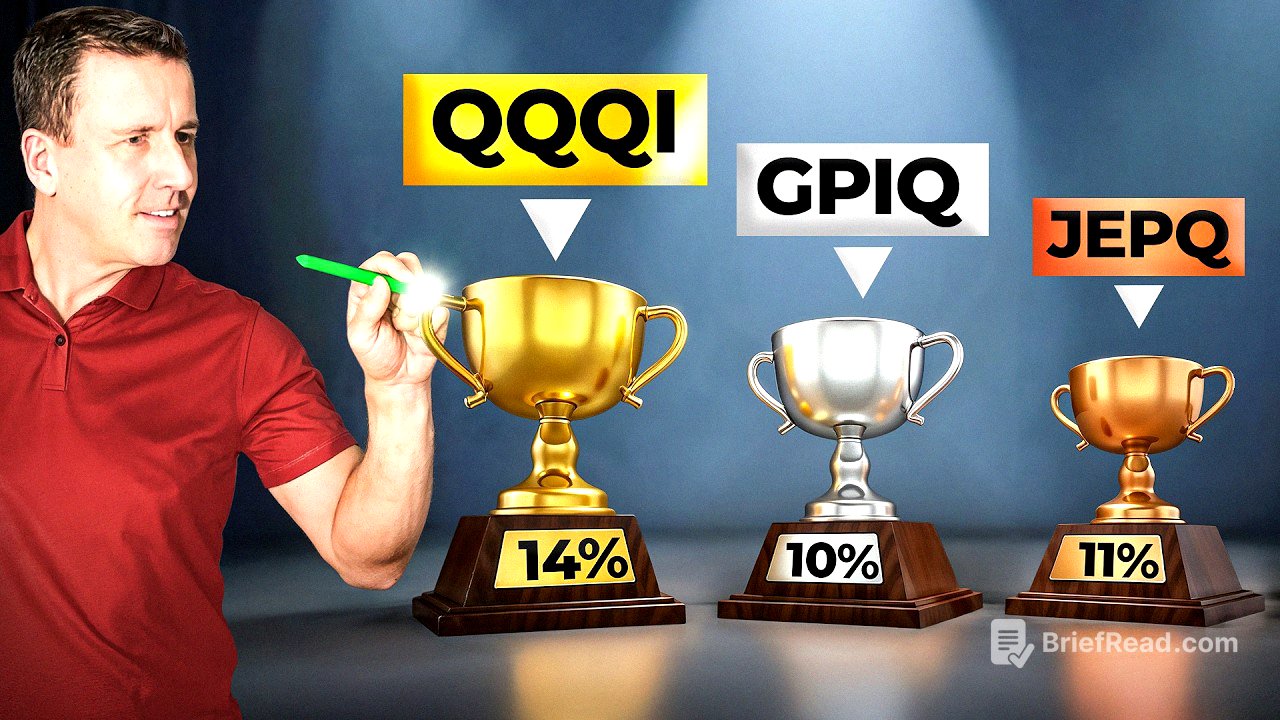
The video introduces covered call funds based on the NASDAQ 100, highlighting their appeal for generating yields in the 10-14% range through selling call options. It focuses on comparing three such funds—QQQI, JEPQ, and GPIQ—and how they navigated market volatility, particularly the "April tariff chaos" where JEPQ's performance faltered.
Distribution Histories for QQQI, JEPQ, and GPIQ [1:00]
The segment reviews the distribution histories of JEPQ, GPIQ, and QQQI. JEPQ, the oldest fund since May 2022, has the most variable income distribution, with its highest payout in November 2022. GPIQ, launched in October 2023, provides more consistent income. QQQI, the newest since January 2024, also offers consistent distributions. The distributions charts are created with Snowball app, that allows to combine stocks from multiple brokerages into one dashboard.
Total Return Comparison [2:12]
The total return chart shows that the three funds tracked each other closely until May 2025, when JEPQ's performance declined. Comparing GPIQ and JEPQ from October 2023 (GPIQ's launch) reveals that GPIQ had a better start and widened its lead by May 2025. The speaker has been holding JEPQ and QQQI to compare their strategies and questions whether GPIQ's initial success was due to luck.
How do the 3 funds differ? [3:48]
The funds differ in yield, stock selection, options strategy, and tax efficiency. GPIQ has a roughly 4% lower yield than QQQI, but their total returns are similar, with GPIQ weighted towards price appreciation and QQQI towards income. QQQI strictly mirrors the NASDAQ 100, while GPIQ can adjust weightings but appears nearly identical. JEPQ actively manages stock weightings, overweighting stocks like Apple and AV and underweighting Nvidia and Microsoft. JEPQ uses equity-linked notes (ELNs) for covered calls, making the process opaque, while GPIQ and QQQI sell calls on the NASDAQ 100 index. NEOS (QQQI) is the most transparent, disclosing call details on their website. NEOS maintained call positions during market correction and wrote new options at higher prices on 50-60% of the fund during the rebound. JEPQ is the least tax-efficient, distributing ordinary income. GPIQ distributes ordinary income and capital gains, with a potential for return of capital (77.8% in 2024). QQQI is the most tax-efficient, with 98.2% return of capital in 2024 due to using index options (1256 contracts). GPIQ has the lowest operating expenses at 0.29%, potentially increasing to 0.35% in April 2026.
Competitors to QQQI, JEPQ, and GPIQ [9:10]
QYLD is a major competitor with over $8 billion in assets and a yield exceeding 13%, but its performance lags because it sells calls at the money on its entire portfolio. QDVO, a newer and smaller fund, shows promise with a growth selection criteria focused on large NASDAQ 100 stocks, weighted towards Mag 7 stocks.
My Take on JEPQ, QQQI, and GPIQ [11:20]
Despite JEPQ's size, history, and reputable management, its recent underperformance has changed the speaker's opinion. The speaker suspects that GPIQ and QQQI's in-house options management provided flexibility during the April volatility. Given QQQI and GPIQ's superior tax efficiency and QQQI's transparency, the speaker is moving funds from JEPQ to QQQI while continuing to monitor GPIQ.