TLDR;
This video provides an Elliot Wave analysis of the NASDAQ 100, discussing potential market movements and key levels to watch. The analysis considers both bullish and bearish scenarios, influenced by factors like VIX expiration, FOMC announcements, and overall market volatility. The market is currently non-committal, making accurate predictions challenging, but potential support and resistance levels are identified for both upward and downward movements.
- The market is non-committal, making predictions difficult.
- VIX expiration and FOMC announcements are key factors.
- Potential support and resistance levels are identified.
Market Overview and Initial Analysis [0:02]
The analyst begins by acknowledging the complexity of the current market situation, noting that the NASDAQ 100's recent performance hasn't clearly defined its trajectory. Despite not breaking major levels, the market's movements have been erratic, leading to uncertainty in the formation of future patterns. The analyst is using a futures market account to analyze the waves.
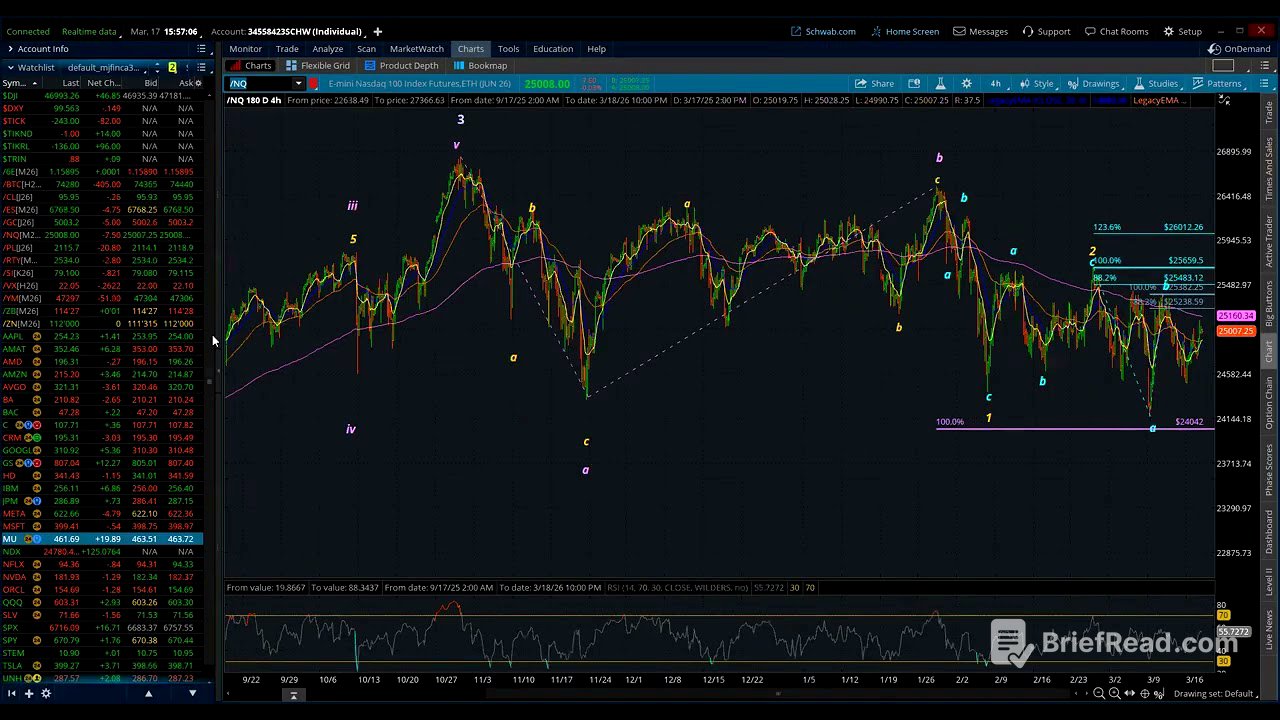
Elliott Wave Count and Potential Scenarios [0:57]
The analyst presents an Elliott Wave count, suggesting the market is in a complex corrective phase. He identifies minuette waves A and B of minute wave four, indicating a C wave down. The analyst expresses uncertainty about whether the current wave three is complete, as it appears shorter than wave one, which violates Elliott Wave principles, especially in a diagonal pattern. The analysis considers the possibility of further upward movement in wave B of three, potentially reaching the 61.8% Fibonacci retracement level.
Impact of VIX Expiration and Risk Sentiment [3:45]
The discussion shifts to the influence of the VIX expiration and overall risk sentiment on the market. The analyst suggests that the current "risk-on" trade, involving selling the VIX and buying underlying volatility through options, may be driving market behavior. This strategy could explain the recent buying activity in the NASDAQ 100. However, the analyst cautions that the market may have already topped out, leading to a larger correction and a shift towards "risk-off" trades.
Potential Downside Targets and Market Correction [5:34]
The analyst outlines potential downside targets, suggesting a significant correction could bring the market down to as low as 22,000 from its current level of 25,000. This potential 3,000-point drop would represent a substantial "crush" rather than a "boost." The analyst also notes the market's recent sideways movement and lack of commitment, emphasizing the need for close monitoring of key levels and expirations.
External Factors and Market Reset [7:57]
The analyst anticipates a market reset, potentially triggered by JP Morgan's collar in the S&P 500, which could lower the trading range and indicate expectations of a market decline. Upcoming events, such as the VIX expiration and the FOMC meeting, are expected to play a crucial role. The analyst expresses skepticism about positive outcomes from the Fed, highlighting concerns about inflation and potential holds on future rate cuts.
Bullish and Bearish Scenarios [9:22]
The analyst presents both bullish and bearish scenarios, acknowledging the market's complexity. A bullish scenario would involve breaking through resistance levels quickly, requiring substantial buying pressure beyond gamma and volatility selling. Conversely, a bearish scenario would involve a market crash, potentially organized but with periods of rapid decline due to high market levels.
Key Levels and Market Direction [11:47]
The analyst discusses key levels to watch for determining market direction. For an upward move, the market needs to break through 25,382 and 25,583 quickly. On the downside, breaking below 24,251 and 24,042 would confirm a C-wave down. The analyst emphasizes the difficulty in predicting market movements due to the current sideways pattern and the need for the market to provide clear signals.
Potential C-Wave Down and Support Levels [13:10]
The analyst details the potential for a C-wave decline, outlining specific support levels at 24624, 2458, 24207 and 23887. These levels would serve as potential completion points for an A-B-C correction. The analyst reiterates the challenging nature of the current market and the frustration in making accurate predictions.
Final Thoughts and Market Outlook [15:51]
In closing, the analyst summarizes the key points and expresses the need for the market to provide clear direction. He reiterates the importance of monitoring VIX expiration and FOMC announcements. The analyst acknowledges the difficulty of trading in the current environment and concludes by stating that the next update will include updated gamma levels.