TLDR;
This video introduces an advanced liquidity trading strategy focused on supply and demand zones. It explains how liquidity, in the form of stop-loss orders and buy/sell stops, accumulates around these zones and how institutional traders exploit this liquidity through false breakouts or liquidity sweeps. The video also presents a confirmation entry model to avoid being lured into false moves and improve trade accuracy.
- Liquidity forms around supply and demand zones, equal highs/lows, and trend lines.
- Institutional traders exploit liquidity by triggering stop-loss and buy/sell stop orders.
- A confirmation entry model, involving a structural shift in the market, can improve trade accuracy.
Introduction to S&D Liquidity [0:00]
The video introduces an advanced liquidity trading strategy that focuses on supply and demand zones. Liquidity plays a significant role in trading outcomes, and this strategy aims to help traders avoid losses and improve accuracy. The presenter will explain the basics of liquidity and then move on to more advanced techniques.
Liquidity Basics [0:21]
Liquidity in the market refers to orders, particularly stop-loss orders, buy stop orders, and sell stop orders. Two common forms of liquidity are equal highs and equal lows, which correspond to resistance and support levels, as well as ascending and descending trend lines. Retail trading education often suggests selling at resistance levels, placing stop losses above the resistance, anticipating the market will react from this level and trade down without breaking above. This leads to a concentration of stop-loss orders above equal highs and buy stop orders, creating buyside liquidity. Stop losses on sell trades are buy orders, so there's a large amount of buy orders above resistance levels. Institutional traders can take advantage of this by triggering these buy orders to execute large sell orders, leading to a liquidity sweep or false breakout. Equal lows work similarly, with stop losses and sell stop orders creating sell-side liquidity that institutional buyers can exploit. Buying from support and selling from resistance can be flawed due to institutional players executing above and below these levels.
Supply & Demand Liquidity Inducements [7:45]
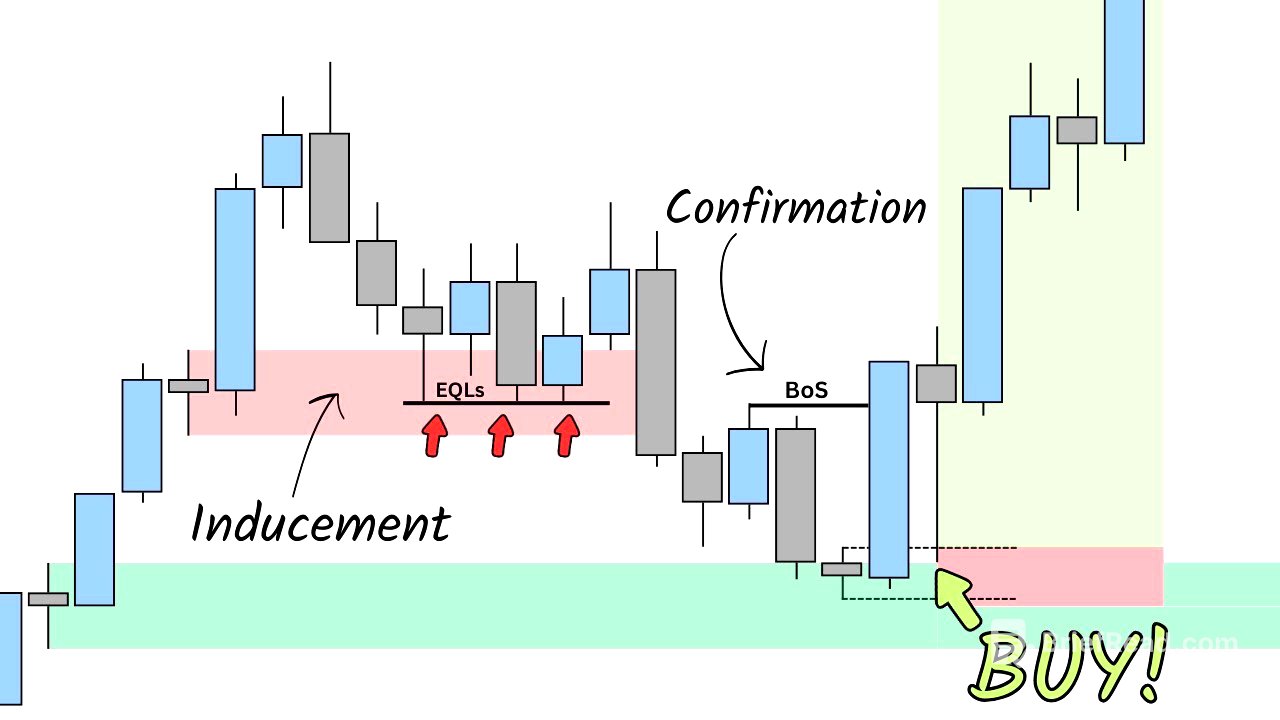
The video transitions to discussing liquidity around supply and demand zones, emphasizing the importance of considering liquidity factors like equal highs, equal lows, and trend line liquidity when analyzing these zones. Creating equal highs or a double top within a supply zone may act as an inducement, luring traders into selling before the market sweeps those highs. The market may extend through the initial supply zone into a higher supply zone, especially when multiple zones are present.
Confirmation Entry Model for S&D liquidity [10:47]
To avoid being liquidated within supply zones or drawn into larger market contexts, the video introduces a confirmation entry model. This model involves identifying a structural shift in the market, where an uptrend (higher highs and higher lows) transitions into a downtrend (lower lows and lower highs). A break into a lower low validates a change in trend, allowing traders to sell on retracements. The absence of this clear shift suggests the market may push higher to sweep liquidity before a change in control occurs. Aligning smaller trend reversals within a larger trend increases the probability of a successful trade. Waiting for confirmation of a reversal helps avoid losses by validating the optimal zone to buy or sell from.
Real Chart Example of S&D Liquidity [15:14]
The video provides a real chart example using Euro Swiss Frank on the 5-minute timeframe to illustrate the concepts. The market is moving upwards, retesting a demand zone and pushing into a new high. The presenter explains how to choose the right demand zone and avoid being liquidated. They analyze multiple potential demand zones, noting the absence of confirmation and the presence of imbalance beneath the first two zones. The market eventually shifts trend after hitting the extreme demand zone, breaking structure and validating buying opportunities. The presenter then isolates the price action to a smaller move, identifying demand zones and applying the inducement theory. They emphasize the importance of waiting for confirmation within these zones, focusing on the lower zone beneath inducement.
Entering the trade [21:26]
The presenter continues the real chart example, scaling the market forward to show how the market pushes down into the first demand zone but fails to break above the high, indicating a likely push through to the lower zone. After the market reaches the lower zone, a break of structure occurs, confirming a change in trend. Because the market has pushed into an efficient range, the presenter identifies the last inefficiency or imbalance within the price move and places a buy limit order at that demand zone, with a stop-loss order beneath the zone and a target towards new highs. The presenter breaks down the trade, highlighting the importance of identifying demand zones, waiting for confirmation, and considering imbalances.
FREE COURSE - System Building [24:43]
The video concludes by showcasing results from trading these concepts and wins from students. The presenter promotes a free course on system building, simplifying trading, and improving trades.