TLDR;
This video explains how to use Fibonacci retracement levels for both trend continuation and reversal trading strategies in various markets like Forex, crypto, and gold. It covers the fundamentals of market structure, including impulses, pullbacks, and ranging markets, and how Fibonacci levels can identify potential reversal points. The video details specific setups for trend continuation using the 78.6% retracement level and reversal trading combining major structure levels, double top/bottom patterns, and Fibonacci retracements, providing step-by-step instructions and real chart examples.
- Market prices move in waves of impulses and pullbacks, influenced by buyer and seller dynamics.
- Fibonacci retracement levels (38.2%, 50%, 61.8%, 78.6%) can identify potential support or resistance areas.
- Trend continuation strategy uses the 78.6% retracement level in trending markets for entries, while reversal strategy combines major structure levels, double top/bottom patterns, and the 61.8% Fibonacci level.
Introduction [0:00]
The video introduces strategies for using the Fibonacci retracement tool to identify profitable continuation and reversal trades in Forex, crypto, and gold markets. It promises a step-by-step guide on setting up trades, determining exit points, and understanding the psychology behind these strategies. The aim is to enable viewers to confidently backtest and trade these setups.
Fundamentals [0:33]
The video explains the fundamentals of market structure, noting that prices move in waves of impulses and pullbacks due to the actions of buyers and sellers. Strong buying interest leads to price increases, while strong selling interest forces prices down. When buyers and sellers are balanced, the market ranges sideways. Understanding when a pullback ends can provide profitable entry points, and Fibonacci retracement levels help identify these points by highlighting potential reversal areas at specific percentages (38.2%, 50%, 61.8%, and 78.6%) between the start and end of a price wave. Pullbacks can be small (38.2% to 50%) in strong trends or deep (50% to previous support) indicating trend weakness. A valid pullback must reach at least the 38.2% level.
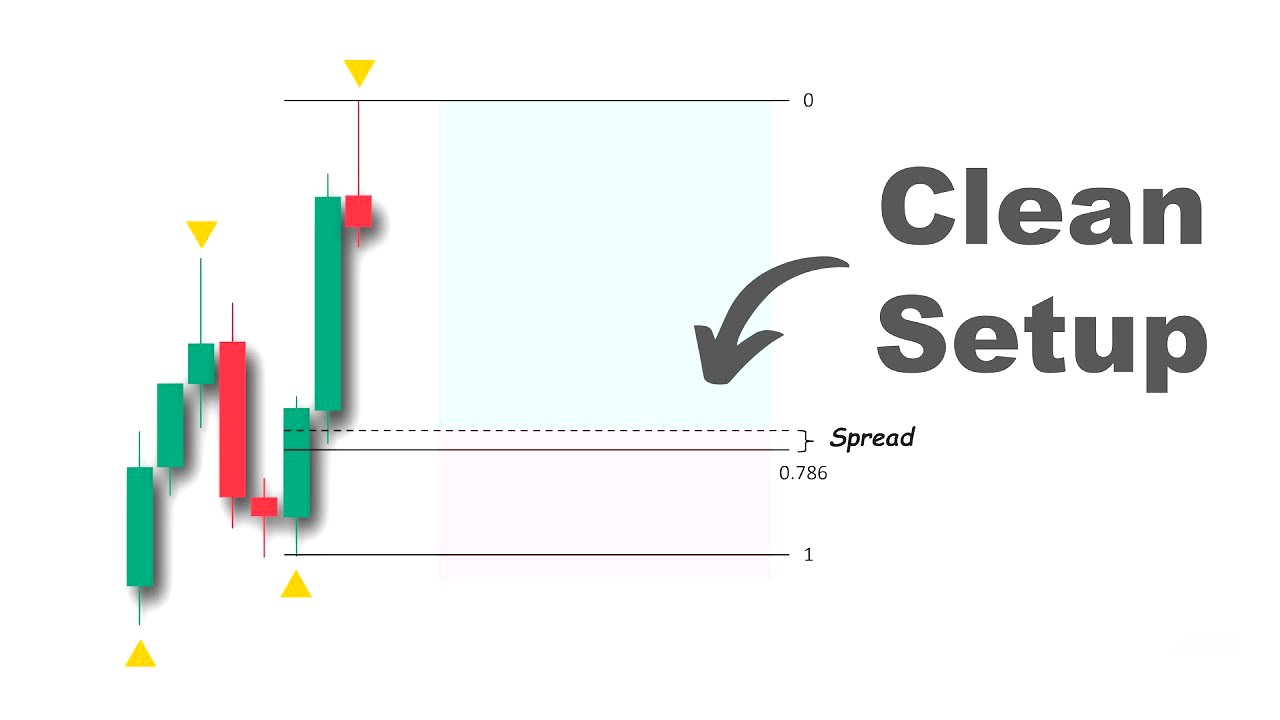
Trend Continuation Setup [4:30]
The video details a trend continuation setup using the 78.6% Fibonacci retracement level, particularly effective for pairs with deep pullbacks like gold. This strategy is best used when the market direction is clear. To execute, identify the trend and latest impulsive move, apply the Fibonacci retracement tool, and set a buy limit order at the 78.6% level with a stop loss just below the swing low and a target at the swing high. This works because in an uptrend, the price is more likely to retest the swing high before breaking the swing low, offering a risk-to-reward ratio of approximately 1:3. While simple and trend-following, it may miss opportunities in strong trending markets with small pullbacks. The video uses the Euro Dollar 1-hour chart as an example, adjusting the retracement tool as the price moves and considering the spread by placing the order slightly below the 78.6% level. It also emphasizes considering the higher time frame market structure to ensure there is enough room for the price to move before reaching a significant zone.
Reversal Trading Setup [10:30]
The video describes a reversal trading strategy that combines a major level of structure, a double top or double bottom pattern, and the Fibonacci retracement tool. A major level of structure is an area where the price has been rejected multiple times and acted as both support and resistance. A valid double top requires the second test's wick to touch a box drawn from the highest candle close to the wick of the first test, without the candle body closing above it. The strategy involves analyzing the higher time frame to find a major level where the price might be rejected, then zooming into a lower time frame for a precise entry. Look for a valid double bottom, and upon the price breaking the neckline, use the Fibonacci retracement tool to place a buy order at the 61.8% level, with a stop loss below the swing low and a target at the next structure level on the higher time frame. An example on gold illustrates identifying a major structure level on the 4-hour chart, then finding a double bottom on the 1-hour chart to execute the trade.