TLDR;
This video provides a comprehensive guide to technical analysis using candlestick charts for trading various financial instruments. It covers the basics of candlestick patterns, multi-candlestick formations, key technical indicators like VWAP and moving averages, and strategies for identifying potential trading opportunities. The importance of multi-timeframe alignment and understanding support and resistance levels are also discussed.
- Candlestick charts offer more detailed price information compared to line charts, indicating market sentiment through their shape.
- Multi-candlestick patterns, such as bull flags and flat top breakouts, can provide stronger trading signals.
- Technical indicators like VWAP and moving averages help traders understand the context of current price action and identify potential support and resistance levels.
Intro [0:00]
The video introduces a comprehensive breakdown of technical analysis and how to read candlestick charts effectively. It emphasizes that technical analysis is a universal language applicable to various financial instruments like Bitcoin, Forex, and stocks. The presenter encourages viewers to take notes and mentions recommended reading materials at the end for further learning.
Intro to Candlestick Charts [1:08]
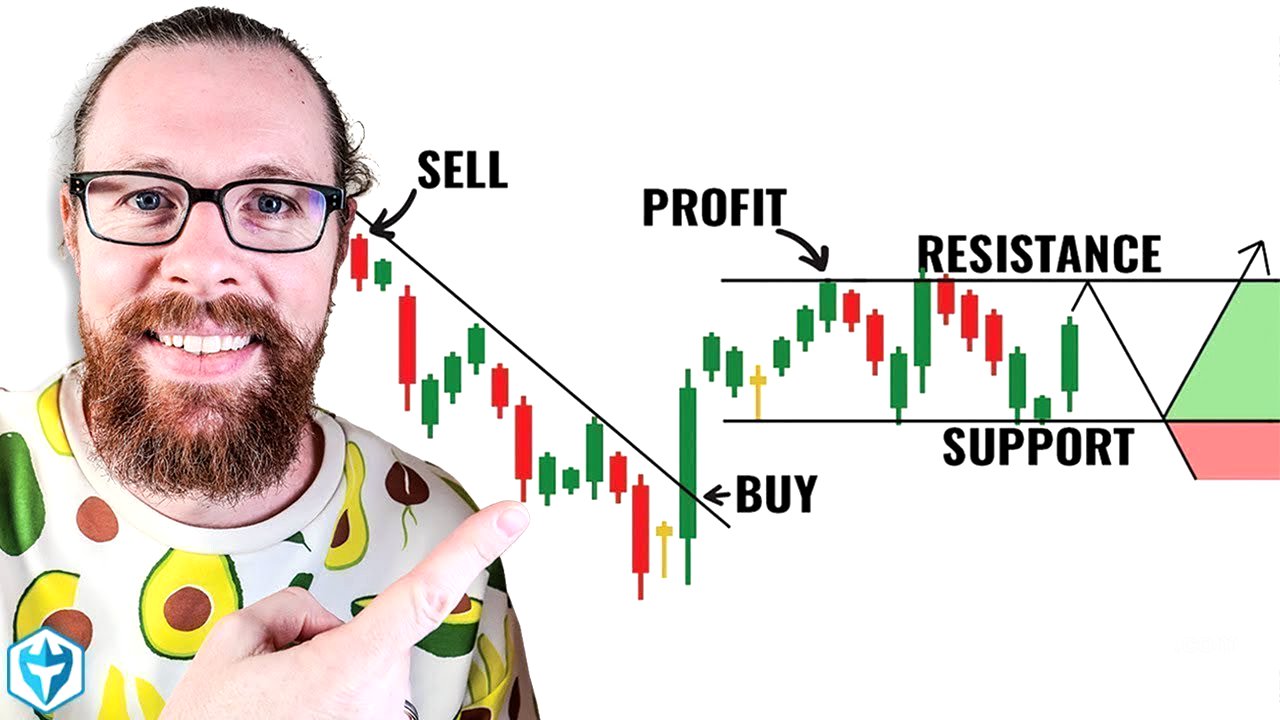
This section explains the advantages of candlestick charts over simple line charts. Candlestick charts provide four key pieces of information: the open, close, high, and low prices for a given period. The shape of the candlestick communicates market sentiment, such as strong buying or selling pressure. Specific candlestick patterns like the "shooting star" and "hammer" are introduced as potential reversal indicators, with the caveat that false signals can occur.
Multi-Candlestick Patterns [5:51]
The discussion transitions to multi-candlestick patterns, which combine individual candlesticks to form stronger trading signals. The video introduces the "bull flag" pattern, characterized by a strong upward move followed by a period of consolidation. It explains the psychology behind the pattern, noting that it represents a momentary exhaustion of buyers before the next wave of momentum. The S&P 500 chart is used as an example to illustrate how these patterns occur in real-world trading.
Bull Flag Pattern [11:01]
A detailed explanation of the bull flag pattern is provided, including specific criteria for identifying valid patterns. The pullback should not retrace more than 50% of the initial move, and the pattern should ideally consist of one to three pullback candles. The presenter prefers trading the first and second bull flag patterns, as later patterns tend to be less reliable.
Flat Top Breakout Pattern [12:09]
The flat top breakout pattern is explained, which occurs when the price consolidates just below a resistance level before breaking out with a strong, long-bodied green candle. The S&P 500 chart is referenced as an example of this pattern.
ABCD Pattern [14:07]
The ABCD pattern is introduced as a variation of the bull flag, where the price makes an initial move up, pulls back, attempts to make a new high but fails, and then pulls back again. This second pullback can create an opportunity for even more buyers to accumulate, leading to a stronger breakout.
Stock Selection [15:41]
The importance of trading instruments that you are familiar with is emphasized, along with the need to focus on stocks with liquidity, volume, and volatility. Active traders need movement in price to profit.
How to use the VWAP [17:05]
The video introduces technical indicators, starting with the volume-weighted average price (VWAP). VWAP represents the average price of a stock over a period, factoring in volume. It serves as an equilibrium point, with prices above VWAP indicating bullish sentiment and prices below indicating bearish sentiment. VWAP is also a respected level of support and resistance.
How to use Moving Averages [22:59]
The nine exponential moving average (EMA) is introduced as a dynamic support level during flag patterns. If the price breaks below the nine EMA, the 20 EMA is the next level of support to watch. The 200 moving average is also mentioned as a key level, particularly on the daily chart.
Volume Bars on Candlestick Charts [24:54]
Volume bars at the bottom of the chart indicate the number of shares traded during each candlestick period. Strong upward momentum should be accompanied by increasing volume. The ideal volume profile for a bull flag pattern is high volume on the initial move up, light volume on the pullback, and then increasing volume on the next leg up.
Multi-Timeframe Alignment [27:30]
The concept of multi-timeframe alignment is introduced, where traders analyze patterns on multiple timeframes (e.g., one-minute, five-minute) to confirm trading signals. Discrepancies between timeframes can serve as warning signs.
1 Minute, 5 Minute and Daily Charts [30:42]
The video explains how to use the daily chart to identify potential levels of support and resistance. Horizontal trend lines are drawn by looking to the left and up to find previous highs and lows. Gaps and windows on the daily chart represent areas with little or no resistance.
Gaps and Windows on Stock Charts [35:25]
Gaps and windows are explained as areas on a stock chart where there is no support or resistance. Gaps occur when a stock's opening price is significantly different from its previous closing price, often due to overnight news.
Ascending and Descending Resistance [36:51]
The video discusses ascending and descending resistance levels, which are trend lines that connect a series of highs or lows. These levels can act as dynamic support and resistance. Channels are formed by drawing parallel trend lines, and financial instruments often trade within these channels. The presenter emphasizes the importance of drawing these lines accurately and adjusting them as needed to reflect market behavior.
Day Trading Strategy [44:59]
The video shifts from technical analysis to strategy, outlining the presenter's approach to day trading. The primary goal is to find an instrument that is moving quickly due to a catalyst or news event. The presenter uses scanners to identify top gainers and then analyzes the charts, starting with the intraday chart and then moving to the daily chart. The 200 moving average on the daily chart is a key level to watch for resistance.
Recommended Day Trading Books [52:41]
The presenter recommends several books for further learning, including "Candlestick Charting Explained" by Greg Morris, "How to Day Trade for a Living" by Andrew Aziz, "The Intelligent Investor" by Benjamin Graham, and "Trading in the Zone" by Mark Douglas.
Outro [55:01]
The video concludes with a thank you to the viewers and a recommendation to check out another full-length class for a more in-depth exploration of the topics covered.