TLDR;
This video provides an in-depth explanation of Candle Range Theory (CRT), including its variations, practical examples, and key strategies for identifying high-probability trading setups. It emphasizes the importance of understanding market structure, timeframes, and psychological filters to enhance trading accuracy and profitability.
- CRT involves analyzing candle formations over specific time intervals, typically using a three-candle pattern.
- The video highlights two primary CRT models: the traditional three-candle model and the CRT plus inside bar, which offers higher probability setups.
- Key concepts include turtle soup (false breakouts), accumulation, manipulation, and distribution (AMD), and the significance of specific times for high-probability setups.
Introduction to Candle Range Theory (CRT) [0:00]
The video introduces Candle Range Theory (CRT) as an in-depth guide for dedicated learners, not a quick fix. CRT played a crucial role in developing the 9 am CR model, which, while rooted in CRT principles and the power of three (open, high, low, close), is a unique approach designed with timing in mind. CRT involves analyzing candle formations over specific time intervals.
Core Concepts of CRT [0:51]
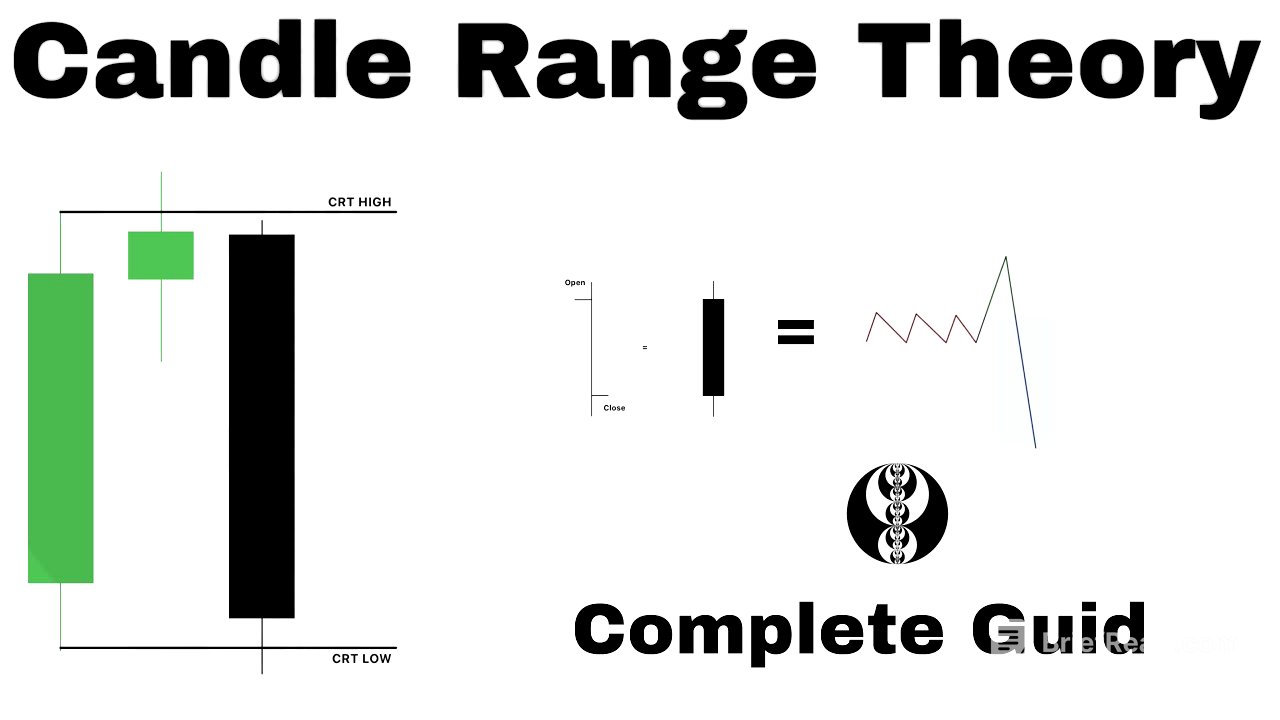
CRT typically manifests as a three-candle pattern, though it doesn't always strictly adhere to this structure. The first candle establishes the range by marking the high and low points. The second candle often manipulates above the initial range, creating a wick or false breakout, commonly known as turtle soup. The third candle typically moves lower, aiming for the range's low.
CRT Plus Inside Bar [1:51]
There are two primary CRT models: the traditional three-candle model and a more advanced version known as CRT plus inside bar. The CRT plus inside bar involves more than three candles to complete the movement from one end of the range to the other, with multiple candles forming within the CRT range. The key difference is that the CRT plus inside bar takes longer to form but offers a higher probability of success, making it beneficial for traders who prefer confirmation or are new to trading.
Examples of Candle Range Theory [2:44]
The video provides several examples of CRT, including instances of turtle soup patterns driving prices to opposite ends of ranges and CRT setups combined with inside bars. These examples illustrate how an algorithm controls the market, with predetermined highs and lows. Combining CRT with concepts like the power of three and turtle soup can yield high-probability trades.
CRT on Lower Time Frames [3:59]
An example of CRT on a lower time frame shows a range high and low, with a turtle soup of the range high leading to a breakdown and formation of an order block. Closing below the order block indicates a change in the state of delivery (CSD), serving as an entry point. Partial profit-taking at equilibrium (EQ) is advised due to the potential for reversals or continuations at this midpoint.
Fractal Nature of Time and Ranges [5:16]
Each candle represents a range, regardless of the time frame (monthly, weekly, daily, 4-hour, 1-hour, 15-minute, or 1-minute). Time is fractal, meaning a daily chart is a higher time frame for a 4-hour chart, and so on. Every timed range is also fractal, and every candle has a high, low, open, and close. Some candles are more predictable than others, especially during certain times of the day, which can help determine the higher time frame bias.
Candle Characteristics and Market Bias [6:11]
Wicking above a candle's high is bearish if the candle doesn't close above it, while wicking below the low is bullish. Closing above a candle's high is bullish, and closing below is bearish. The power of three, also known as AMD (accumulation, manipulation, distribution), represents three stages of price movement, each with a specific role.
Power of Three and CRT [6:56]
In a three-candle CRT, one candle is accumulation, another is manipulation, and the third is distribution. The highest probability trades occur when this pattern is understood, as it happens in every candle because time is fractal. An example illustrates accumulating sell-side and buy-side liquidity, sweeping sell-side liquidity, hitting a key level, manipulating with turtle soup, and distributing higher.
Entry Points and Order Blocks [7:54]
The video discusses identifying entry points, particularly focusing on order blocks. In a bearish scenario after a range high is souped, the entry is short at the order block that forms and is confirmed when the price closes below it. The price then retraces into the order block, providing an entry to short towards the midpoint and opposite end of the range.
Types of CRT: Three Candle and Inside Bar Plus [8:31]
There are two types of CRT: the three-candle CRT and the inside bar plus CRT. The three-candle CRT involves three candles representing accumulation, manipulation, and distribution. The first candle sets the range, and after it closes, the high and low points are marked. The second candle usually moves above or below this range, creating a turtle soup, which offers advanced entries for experienced traders. The third candle is where the fastest and most likely trades occur, representing the distribution phase, which is suitable for beginners.
Entry Strategies for Bullish and Bearish Trends [9:12]
For bearish trends, look for entry points above where the third candle opens; for bullish trends, look to buy below the third candle's open. An example on a lower time frame shows the first candle setting the range, the second candle breaking above the range to create a turtle soup, and the third candle forming a strong upclose candle (order block) that touches a key price level.
Refining Entries on Lower Time Frames [10:07]
Refine entries by moving to lower time frames. For example, if the CRT low and high are on a 4-hour chart, drop down to the 1-hour chart to find a lower time frame CRT. On the 15-minute chart, refine the entry even more by looking for a candle open souping the range low of the lower time frame CRT for a bullish setup, buying below the open of the candle right after hitting the key level on the 4-hour chart.
Utilizing the 5-Minute Chart for Entries [11:09]
On the 5-minute chart, the same idea applies: the candle opens, dips below the 1-hour range low, and you wait for the next candle to open, buying below this open and aiming for a long position targeting the opposite end of the higher time frame range, taking partial profit at the midpoint. If studied as intended, only three candles are needed, marking a turning point in trading.
Selecting the Right Candles for CRT [11:37]
It's crucial to understand which candles to pick for CRT, focusing on those with the highest probability. First, define the range you want to trade (monthly, weekly, daily, 4-hour, 1-hour, etc.). Whatever range you pick, look for the power of three, as there's always an open, high, low, and close on every candle.
Timeframe Alignment for CRT [12:32]
If trading the monthly range, focus on the 4-hour chart; for the weekly range, focus on the 1-hour chart; for the daily range, focus on the 15-minute chart; for the 4-hour range, focus on the 5-minute chart; for the 1-hour range, focus on the 1-minute chart; and for the 15-minute range, consider the 15-second chart. However, using lower time frames for entries is not recommended, as this approach is solely for identifying the power of three.
Candle Functions and Market Dynamics [13:06]
Every candle has a function: the price will always open, form a turtle soup, and then decline when the market is bearish, and vice versa when it's bullish. Candle one represents accumulation, candle two represents manipulation, and candle three represents distribution. The manipulation stage often offers the most advanced entries, where turtle soup occurs, while the distribution stage provides the most optimal trade entries, especially for beginners.
Enhancing Accuracy with Time and Key Levels [13:43]
Enhance accuracy by blending the candles of CRT with the times when the high or low of the day, week, month, or year are formed. This provides a more precise read on the markets. If entering on the third candle, the trade is likely to be very fast because it is the distribution leg of the model. Always take partial profits at 50% of the range, as reversals often occur at this point.
Avoiding Retail Traps and Understanding Market Movements [14:32]
Avoid being caught off guard by understanding who is likely to be trapped. Retail traders often buy above highs and sell below lows. When bullish, there will be a turtle soup followed by a rally and then a drop close to the turtle soup low, forming a failure swing low. When bearish, the same pattern occurs: turtle soup, drop, rally, and then a drop close to the turtle soup high, forming a failure swing high.
Failure Swings and Key Levels [15:31]
Every turtle soup will have a specific failure swing high, which tends to scare more people out of the market. For this pattern to be correct, the turtle soup low must be created at a specific time on the chart. Examples show turtle soups at key levels, followed by rallies and drops close to the swing low, leading to higher distribution.
Entry Techniques Using Candle Range Theory [16:33]
The first and most advanced way to enter is on the second candle with a turtle soup setup. The second way is using the order block or a change in the delivery state. The third way is through a market structure shift followed by a breaker or an optimal trade entry. Focus on trading the order block only when the candle that sweeps liquidity is thick and strong.
Validating Order Blocks and Using the Third Candle for Entries [17:27]
To validate order blocks, never enter on a small or weak candle. The third candle in a CRT setup provides an entry based on model one, which combines the order block and turtle soup. This trade is typically very quick. An optimal trade entry (OTE) can also be found within this candle in a three-candle CRT setup.
Timing Highs and Lows and Market Consolidation [17:44]
Understanding the times when highs and lows are likely to form throughout the day is crucial. There are specific times when highs and lows have a higher probability of forming. Every high and low of each candle is timed, and nothing is random. The market consolidates at certain times and expands at others.
Focus and Chart Study [18:02]
Focus on studying the charts and concentrate on one or two asset classes at most, learning them well and memorizing their patterns. Candle number one is accumulation, candle number two is manipulation, and candle number three is the fast move. Aim to capture as many candle number threes as possible, ignoring candle two and focusing on those candle threes.
Avoiding Forced Setups and Recognizing Clear Entries [18:26]
Avoid forcing a turtle soup setup; if it feels forced, don't enter the trade. The turtle soup entries you should take will be clear and obvious.
Examples of CRT and Timeframe Application [18:40]
The video provides more examples, such as a range with a high and low where a turtle soup on the low, without closing below it, indicates a bullish trend towards the opposite end of the range. This applies to every time frame, but the highest probability CRT ranges form at specific times of the day.
Lower Timeframe Analysis and the Monday Range Model [19:02]
On a lower time frame, candle one (Monday) forms the range, candle two (Tuesday) represents manipulation, and candle three (Wednesday) represents distribution. The sequence includes a range high, range low, turtle soup on the range low, change in state of delivery, order block formation, order block hit, and a long targeting the opposite end of the range.
Entering on the Third Candle and the Importance of Midpoints [19:31]
To enter on the third candle, wait for it to open. If the CRT low was souped with the second candle (Tuesday), when the third candle opens on Wednesday, wait for the price to move back below Wednesday's open and then go long, targeting the CRT high. This turtle soup is a model in itself, known as the Monday Range model, where Monday is the range, Tuesday is manipulation, and Wednesday is distribution.
Analyzing Candle Number Three and Bullish Bias [20:15]
The quickest trades occur within candle three. If the bias is bullish because the range low was souped and closed above it with a wick below, wait for the price to reach below the third candle's open, creating a turtle soup at the midpoint of Tuesday's range. Look for turtle soups and entries on the third candle at the midpoint of the second candle in a CRT range.
Summary of CRT Components and A+ Setups [20:56]
The first candle forms the range, the second candle manipulates it, an order block forms, the state of delivery changes, structure is broken, an order block forms, and then the price taps into the order block for a long entry. The third candle opens and moves back below its own open towards the midpoint of Tuesday's range, creating a turtle soup at that midpoint. Always look for the turtle soup at the equilibrium of the second candle in the range below the third candle's open.
Entry Points and Bearish Trend Examples [21:52]
The first entry could be the turtle soup, and the second entry would be the order block that closes above and taps back into it for a long trade, targeting the opposite end of the range low. Another example shows three candles forming a range with a high and low, where a wick above signals a bearish trend and the third candle distributes.
Confirmations for High Probability CRTs [22:18]
To spot the highest probability CRTs, look for specific confirmations: the CRT must form at a specific time, the liquidity sweep (turtle soup) should happen at a specific time, a key level on a higher time frame within, below, or above the CRT increases the chance of a high probability CRT, inside bars automatically indicate a high probability setup, and a lower time frame CRT within a higher time frame CRT is another strong confirmation.
Higher Time Frame Key Levels and the Divide by Four Rule [23:04]
Using a higher time frame key level to validate the CRT high and low will increase the win rate. Key levels always come from a higher time frame, but not just any random higher time frame. The "divide by four" rule helps determine the correct higher time frame: if you have a higher time frame key level from the 1-hour chart, your CRT will form on the 15-minute chart, and vice versa.
Applying the Divide by Four Rule Across Timeframes [24:07]
Apply the divide by four rule to other time frames: if looking at a CRT on the 1-hour chart, the key level will come from the 4-hour chart; if on a 4-hour chart, the key level will come from the daily or weekly chart; if on the daily chart, the key level will come from the weekly or monthly chart; and if on the weekly chart, the key level will come from the monthly or yearly chart.
Key Levels Within Lower Time Frame CRTs [25:09]
A perfect example involves a higher time frame key level within the lower time frame CRT. On a 15-minute chart with the key level coming from an hourly chart, the CRT high and low formed, the key level was hit, and the range was created. Sweeping the range low and coming back above the key level caused the price to explode upward.
Entry on the One Minute Chart and Order Block Validation [26:22]
If a CRT forms on the 15-minute chart, use the 1-minute chart for entries. A sweep of the CRT low, followed by the price closing above it, indicates a change in the market. This validates the order block, which is a strong down close candle touching the key level and tapping the CRT low.
CRT with Higher Time Frame Key Levels Above or Below [27:09]
An example of a CRT with a higher time frame key level above the CRT shows the CRT forming on the 1-hour chart and the key level coming from the 4-hour chart. Sweeping the CRT high makes it likely to hit that key level, representing a high probability trade.
Entries on the Five Minute Chart and Order Block Formation [28:06]
Move down to the 5-minute chart for entries when the CRT is on the 1-hour chart. An order block forms as a strong upclose candle that taps both the CRT high and the key level. A turtle soup occurs with the price closing below the order block, indicating a change in market behavior.
Lower Timeframe CRT Within a Higher Timeframe CRT [28:48]
Using a lower time frame CRT within a higher time frame CRT represents a high probability trading scenario. Start on a higher time frame like the 4-hour chart and mark the CRT, identifying the high and low. Wait for one end of the range to be hit, then switch to a lower time frame like the 1-hour chart and divide by four. Draw the CRT on the candle that hits the higher time frame's CRT high or low.
Identifying Key Highs and Lows [29:24]
This specific setup is key to forming significant highs and lows and is an essential pattern in price action. An example shows a 1-hour CRT forming within a 4-hour CRT, with the 1-hour CRT high and low respected within the 4-hour CRT high and low.
Timeframe Alignment for CRT Entries [30:36]
If the CRT is on the monthly chart, entries should be taken from the daily chart; if on the daily chart, entries should be on the 1-hour chart; if on the 4-hour chart, entries should be on the 15-minute chart; if on the 1-hour chart, entries should be on the 5-minute or 1-minute chart; and if using the 15-minute chart for CRT, entries should be on the 1-minute chart.
High Probability CRTs for Forex and Futures [31:17]
For Forex, focus on 1 a.m., 5 a.m., 9 a.m., 1 p.m., 5 p.m., and 9 p.m. For futures, key times are 2 a.m., 6 a.m., 10 a.m., 2 p.m., 6 p.m., and 10 p.m. These are specific times on the 4-hour chart to look for CRT ranges.
High Probability Turtle Soups and Purges [32:10]
Turtle soups need to form at specific times to be considered high probability. If the turtle soup doesn't occur at the right time, don't take the trade. Filter trades by looking for turtle soups at 3 a.m., 6 a.m., 9 a.m., and 1 a.m.
Aligning CRTs with Turtle Soups [33:03]
The CRT range will form in the first week of the month, and the turtle soup will occur in the second week. The CRT range will form on Monday, and the turtle soup will form on Tuesday or Wednesday. If the CRT forms on Friday, the turtle soup will occur on Monday.
Examples of CRT and Turtle Soup Alignment [34:01]
For Forex, if the CRT formed at 5 p.m., the turtle soup will form at 3 a.m. For futures, at 10 p.m., the CRT range forms, and at 1 a.m., the turtle soup occurs. Another example shows a 5 a.m. CRT range high and low with a 9 a.m. turtle soup.
The Importance of Psychology in Trading [35:19]
Psychology is what sets traders apart from beginners. Apply filters to trades to filter out low probability trades, saving capital for high probability trades only.
The Filter Process and A+ Setups [35:56]
An A+ setup should be the only setup executed. While back testing, you'll see higher probability setups (A+ setups) and lower probability ones. Treat the A+ setup as the only setup to execute, filtering out everything else.
Avoiding Impulses and Focusing on Risk to Reward Ratio [37:08]
Avoid impulses or gut feelings and focus on the risk to reward ratio and percent gain/loss. Set a standard risk to reward for yourself (e.g., 2:1, 3:1, 1:1, or 5:1) and stick to it. Be patient and wait for the right trades to form.