TLDR;
This video provides a detailed explanation of the Candle Range Theory (CRT), including its applications, advantages, and disadvantages. It covers how to identify candle ranges, anticipate price movements, and use CRT for both higher and lower time frames. The video also introduces ETM modifications to optimize trades, discusses the importance of context, and offers insights into setting targets and managing risk.
- Understanding Candle Range Theory (CRT) and its applications.
- Identifying key levels within a candle range for potential trades.
- Recognizing the significance of context and order flow in CRT.
- Applying ETM modifications to enhance the effectiveness of CRT.
- Setting realistic targets and managing risk for successful trading.
Introduction to Candle Range Theory (CRT) [0:01]
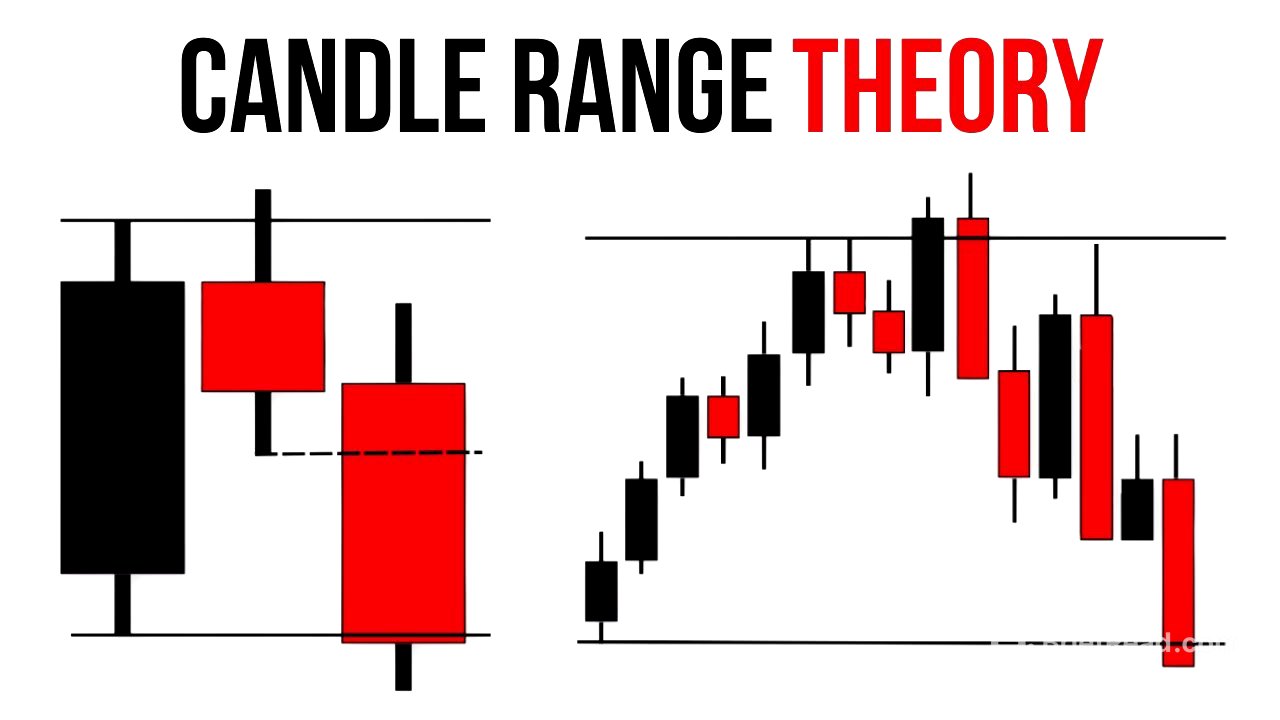
The lesson introduces Candle Range Theory (CRT), explaining its purpose, applications across different time frames, and its pros and cons. The theory revolves around understanding price action within a single candle's range, which is defined by its high and low. The presenter also mentions ETM modifications to enhance the theory's effectiveness.
Understanding Candle Range Formation [0:34]
A bullish candle's range is formed by its high and low, representing a swing low and swing high on lower time frames. The anticipation for the next candle is that it will fill out the range, absorbing liquidity beneath the swing low. The trigger for a trade is when the current candle's low is breached, anticipating a move to the bottom of the range.
Lower Time Frame Perspective of CRT [1:48]
On lower time frames, a bullish candle consists of consecutive swings. When the next candle starts bullish but reverses inside the range, it forms a change of character. The target then becomes the candle low, which corresponds to the bottom of the breakup structure on the micro level.
High Volume Continuation Entry [2:54]
The high volume continuation entry involves entering a trade immediately when the price breaks below the candle low, targeting the bottom of the range. This is essentially a breakout trade.
Basic Functions of a Candle [3:14]
A candle has four basic functions: open, low, close, and high. On lower time frames, the candle open can lead to accumulation or manipulation towards the candle low, followed by distribution towards the candle high, and a pullback for the candle close.
Instant Internal Rejection: Lower Time Frame Expectations [4:06]
Instant internal rejection focuses on the third candle, where the lower time frame formation occurs. This happens when a candle opens and immediately targets an internal liquidity level, such as an extreme supply zone, rejects, and covers the entire candle's range.
Trading Instant Internal Rejection [4:45]
A bullish candle trapped in a bearish candle's range indicates liquidity has been taken. The trigger point is the current candle's high, and the expectation is for the price to target an internal level, such as a bullish order block, before flipping and closing out the entire range.
Recap of Instant Internal Rejection [6:31]
The recap explains that after a bearish candle closes, if the price takes out the high and closes back inside the previous bullish candle, the target becomes the bottom of the candle's range. The next candle is expected to complete this range. From a micro standpoint, the next candle starts bullish, targets an internal liquidity level, rejects, and forms a wick, with the ultimate target being the low of the range.
Instant External Sweep [9:19]
Price aims to grab external liquidity before attacking the trigger point and closing the range. On the macro level, the price starts bullish but quickly flips, with the bullish movement forming a wick. The next level is closing out the range once the price approaches the trigger point.
Trading Instant External Sweep [9:51]
With a bearish candle trapped inside a bullish candle, the focus is on a liquidity sweep. The goal is for the price to quickly grab liquidity, such as a swing high, and then target the level. Once the price gets below this level, it confirms the move.
Recap of Instant External Sweep [11:34]
The recap illustrates that the price can target either the previous day's or the current day's liquidity level. After taking out a liquidity level, the price drops back into half the range and gets below the trigger point, initiating the trade with the target of covering the entire range.
The Importance of Context in CRT [12:49]
Context is crucial in CRT, especially in live markets. For example, in a bullish trend, a bearish candle might still induce buy positions based on previous bullish momentum. However, an extreme supply level to the left can halt the bullish trend and cause a bearish reversal.
Contextual Variations in CRT [14:10]
Even with bullish recent swings, a break in structure on the macro level can indicate bearish momentum. If the next candle starts bullish but closes bearish, it's likely to continue bearish, especially if major liquidity was taken out.
Anticipating CRT Based on Context [15:17]
Retail traders might anticipate a bullish trend after a character change, but CRT is anticipated because a bearish candle is trapped within a bullish candle. Price took out liquidity, came back inside the range, and provided enough range to work with. Additionally, the candle took out major swing liquidity and came back inside the macro range.
Applying CRT in Real-Time Scenarios [17:23]
In real-time scenarios, traders can target the extreme of the range or wait for a rejection from specific levels before entering at the trigger point. This approach allows for flexibility based on price action.
Contextual Analysis with CRT [18:40]
Even if price takes out liquidity, leading some traders to anticipate a return to origin or subordinate resistance, a bearish perspective can be maintained. This is due to factors like a bearish order block and rejection from a significant swing level, supported by lower time frame analysis showing rejection of structure.
ETM Modified Model: Double Scoop [21:27]
The ETM modified model, known as the double scoop, involves price starting bearish and attacking the trigger point. Instead of continuing to the downside, price reverses bullishly, revisits the area, and then fully closes the range.
Understanding the Double Scoop Entry Model [21:59]
In the double scoop entry model, price first takes out the trigger point but returns to look for external or internal liquidity before revisiting the trigger point. Once price returns to the trigger point for the second time, a smooth ride to close out the range is anticipated.
Applying the Double Scoop Entry Model [22:53]
Using the double scoop entry model, traders expect the price to reach the trigger point but then return to look for internal liquidity before continuing to the downside. This can involve marking up the extreme of the range or looking for an order block on a lower time frame.
Targets and High Probability Exits [24:47]
Targets are crucial, and the highest probability exit is often at the 50% level between the trigger point and the bottom of the range. Traders can take partial profits at this level and move their stop-loss to break even.
Examples of Target Selection [26:25]
Examples show that price often reaches the 50% level, reverses, or closes the day outside the range. The 50% level is highlighted as a high probability exit point.
Danger Points and Fair Price [27:34]
The first target should be the fair price, where the price is even. Discount levels are where the price could be bought, and external liquidity at the bottom of the range is the third target. Price often finds it easier to reach the first target but harder to reach subsequent targets.


![[타로]🌹갓 신내림 받은 것처럼 잘맞는🔥현재 그 사람, 100% 이런 감정 느낍니다🔮상대방의 진짜 속마음](https://wm-img.halpindev.com/p-briefread_c-10_b-10/urlb/aHR0cDovL2ltZy55b3V0dWJlLmNvbS92aS9UWVVVQmZEdUNXOC9ocWRlZmF1bHQuanBn.jpg)