TLDR;
This video by Ross Cameron from Warrior Trading teaches seven candlestick chart patterns he uses daily. It emphasizes simplicity for beginner traders, advising them to master one or two patterns. The video covers candlestick reading, technical indicators, and specific chart patterns with entry and exit strategies to improve trading accuracy and profitability.
- Candlestick charts as visual displays of price action over fixed periods.
- Importance of technical indicators like volume bars, moving averages, VWAP, and MACD.
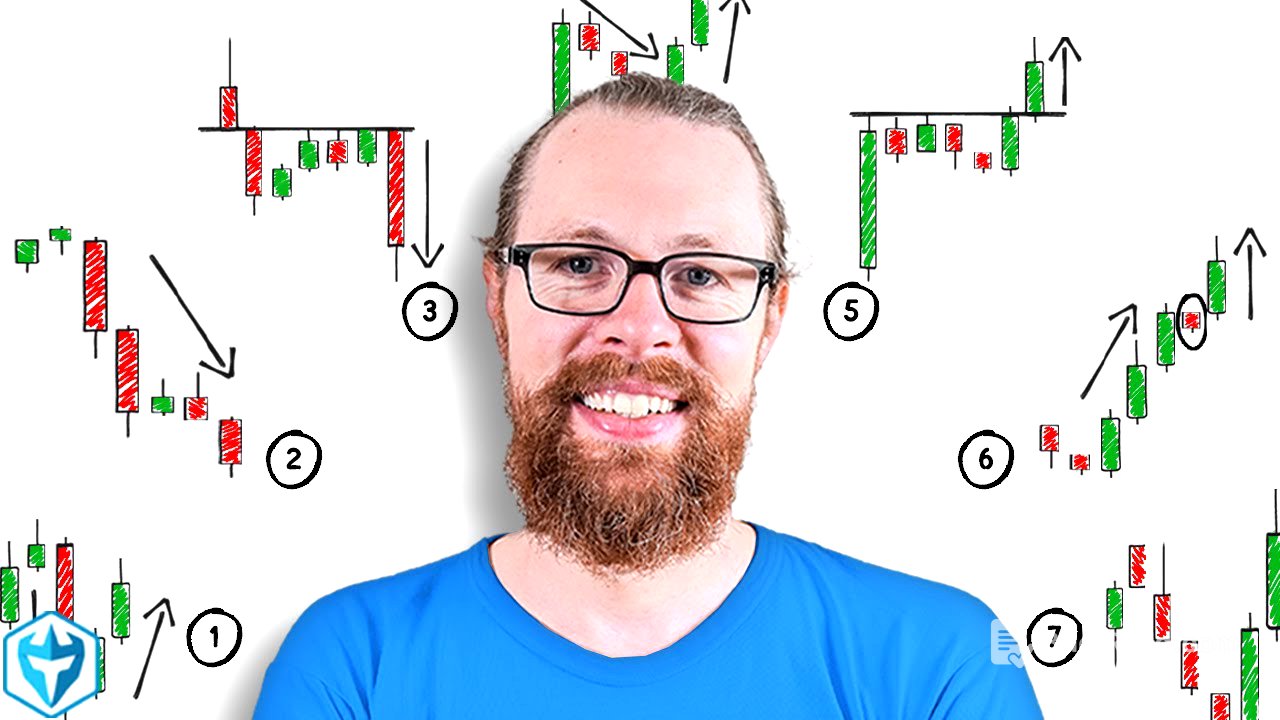
- Seven candlestick patterns: Candle Over Candle, Micro Pullback, Bull Flag, ABCD Pattern, Cup and Handle, Inverted Head and Shoulders, and Break of VWAP.
Introduction to Candlestick Charts [0:01]
The video introduces candlestick charts as visual records of price action over a specific time frame, which can range from seconds to days. Each candlestick communicates four key pieces of information: the open, close, high, and low prices. The shape of the candlestick reflects market sentiment, with different shapes indicating strength or weakness. Learning to read candlestick charts is akin to learning a language, where shapes are associated with specific emotions and market behaviors.
Understanding Candlestick Anatomy [0:45]
Each candlestick provides four pieces of information: the open, close, high, and low. For a green candle, the open is at the bottom of the body, and the close is at the top. The wicks indicate the high and low prices reached during that period. Different candlestick shapes communicate different market sentiments. For example, a long upper wick suggests selling pressure, while a long lower wick indicates buying support.
Technical Indicators for Trading [8:43]
Technical indicators are essential tools to avoid unnecessary losses and improve the quality of trade setups. The four key indicators used are volume bars, moving averages, Volume Weighted Average Price (VWAP), and Moving Average Convergence Divergence (MACD). Using these indicators as part of a checklist can provide double confirmation for trade decisions, increasing accuracy and profitability. Trading quality setups improves accuracy, leading to more winners and a better profit-to-loss ratio, which in turn boosts confidence and allows for increased trade sizes.
Volume Bars [14:27]
Volume bars indicate the number of shares traded during each candlestick period, with green bars representing buying volume and red bars representing selling volume. Analyzing volume helps visualize whether there is more buying or selling pressure, which is crucial for understanding market sentiment. Increasing buying volume supports bullish trends, while higher selling volume can signal potential reversals.
Moving Averages [18:28]
Moving averages display the average price of a stock over a set period, such as the 9 EMA, 20 EMA, and 200 EMA. These averages act as support and resistance levels, with the 200 EMA being a significant level on daily charts. On intraday charts, the 9 EMA and 20 EMA are well-respected levels of support. The price often bounces off the 9 EMA, and if it breaks, it typically finds support at the 20 EMA.
Volume Weighted Average Price (VWAP) [25:56]
VWAP reflects the average price of a stock, weighting the volume at different price levels. It represents the true equilibrium point for the day. If the price is above VWAP, it is considered bullish, and if it is below, it is bearish. VWAP is an intraday indicator that resets daily and is the same across all intraday time frames.
Moving Average Convergence Divergence (MACD) [31:18]
MACD is an oscillating indicator that shows the relationship between two moving averages. When moving averages diverge, it indicates that the price is moving quickly. When they converge, it signals that the price is slowing down and the trend may be shifting. The standard settings for MACD are 12, 26, and 9. Trading decisions are often based on whether the MACD is positive or negative, providing signals for potential buying or selling opportunities.
Candle Over Candle Pattern [38:15]
The candle over candle pattern involves two candles where the second candle continues higher than the first. This pattern can occur in the context of a rapid price increase or a change in direction. The most favorable setup is when it signals a change in direction, with the first candle making a new high. The maximum loss is the bottom of the first candle, and the profit target is based on the expectation that the price will continue to extend higher, supported by increasing volume.
Micro Pullback Candlestick Pattern [50:05]
The micro pullback pattern consists of three to five candles, starting with a candle that makes a new high. After the initial surge, the price dips down for one to three red candles before the next green candle makes a new high. This pattern is often seen on stocks hitting scanners due to breaking news or significant price movement. Traders buy the first candle that makes a new high after the pullback, with the expectation of a continued squeeze.
Bull Flag Pattern [1:01:36]
A bull flag is similar to a micro pullback but involves a slightly longer pullback, typically two to four candles. The key difference is the time it takes to form. Bull flags on a five-minute chart are distinct from micro pullbacks on a one-minute chart. Traders look for the first candle to make a new high after the pullback, buying during the green candle with a stop loss at the low of the pullback.
ABCD Pattern [1:04:44]
The ABCD pattern occurs when a bull flag fails. The price pops up, dips down, pops up again, and then dips down further. It is crucial that the price holds the low point; otherwise, it indicates a stairstepping down pattern. Traders often wait for the price to break through a new high of day before entering the trade. While ABCD patterns can provide resolution, micro pullbacks and bull flags are generally preferred due to their faster and more reliable nature.
Cup and Handle Pattern [1:08:48]
The cup and handle pattern begins with a price squeeze followed by a deeper pullback, creating a double top resistance level. The "handle" is a small bull flag that forms after the double top. Traders buy the breakthrough resistance, looking for a squeeze higher. This pattern is appealing because it signals that a stock that was previously strong, sold off, and is now making a comeback.
Inverted Head and Shoulders Pattern [1:12:52]
The inverted head and shoulders pattern forms after a price squeeze and subsequent dip. It resembles a bull flag that fails, breaking down to a lower level before a sideways movement and a pop back up. The pattern includes a "head" (the lowest dip) and "shoulders" (sideways movements on either side). Traders anticipate a squeeze back up to retest the high, using this pattern as a signal for potential bullish movement.
Break of VWAP [1:17:10]
The break of VWAP pattern occurs when the price squeezes up, hits the scanners, and then sells off. The setup involves waiting for the price to break back above the VWAP, signaling a change in control from shorts to longs. This moment is marked by high volume as shorts cover their positions and longs initiate new positions. Traders look for this pattern as an entry point for potential upward movement.
Exit Indicators [1:20:38]
Key exit indicators include large sell orders on the Level 2, large topping tail candles, high volume red candles, slowing buying on the time and sales, and the price stopping its upward movement. The philosophy is to "break out or bail out," as the best trades work almost instantly. If a trade does not perform as expected, it is better to exit the position.
Recommended Reading [1:23:23]
The video recommends three books: "Thinking in Bets: Making Smarter Decisions When You Don't Have All the Facts" and "Quit: The Power of Knowing When to Walk Away" by Annie Duke, and "How to Day Trade: The Plain Truth" by Ross Cameron. These books provide insights into decision-making, risk management, and knowing when to exit trades, all crucial for successful trading.