TLDR;
Alright, so this session is all about getting familiar with R programming for research. Dr. Ashutosh Gaur takes us through the basics, explaining why R is a great tool, how it came to be, and how to set it up. The main takeaway is that R is free, versatile, and lets you see exactly how results are calculated, which is super important for research.
- R is a capable software to teach teacher as a faculty if we are in the field of sectional study if we are field of time series or a qualitative study that's one benefit and again ofcourse it's a free of cost.
- R is a solution there when we give an assignment we can give an assignment in R and student can write all program all statements how he had got particular result he has to show everything to us step by step so that means we can see and we can do ourself also how he she got pericular result result be reproducible.
- R is like a Goddness Hanuman, you have to remember what you want to do and download the required packages.
Introduction and Welcome [0:05]
Dr. Ashutosh Gaur is introduced as an experienced academic leader with a background in management, marketing, IT, and data analytics. He's currently an Associate Professor at एनआईटी Business School, focusing on aligning curriculum with NBA standards and NEP 2020 policies. He's also known for incorporating emerging technologies like AI and blockchain into academic frameworks.
Why Learn R? [6:54]
Dr. Gaur explains why learning R is important for faculty and students. Unlike other software, R can handle various types of research (cross-sectional, time series, qualitative, medical) and is free of cost. It also ensures students understand how they get their results, improving the quality of research. Plus, R can handle large datasets and create dynamic data visualizations.
The Story Behind R [10:12]
R was created by Robert Gentleman and Ross Ihaka, both of whose names start with "R." The goal was to make a user-friendly software for statistics. While there are versions similar to SPSS, this workshop will use R Studio, a versatile software that balances programming basics with ease of use. To get the most out of the workshop, participants need a good internet connection and should be ready to install and execute code.
Installing R [13:51]
Participants are guided to download R for Windows (or Mac if applicable) from Google. After downloading, they need to execute the .exe file to install the software. Dr. Gaur emphasizes that even those without a computer science background can benefit from learning R, especially for qualitative studies.
Installing R Studio [24:29]
After R is installed, participants are instructed to download R Studio. It's important to install R first, then R Studio. Once installed, the R Studio icon should appear in the program files.
Exploring R Studio Interface [1:05:03]
Dr. Gaur explains the R Studio interface, which consists of three panes: the console pane, the global environment, and the file/plot/package/help pane. He also mentions the importance of the "Tools" menu for installing packages and the "Session" menu.
R as Lord Hanuman [1:09:08]
R is compared to Lord Hanuman, who had forgotten his powers. Similarly, R has a base package, and you need to "remember" or download specific packages for different tasks (time series, qualitative, quantitative).
Basic Commands and Packages [1:11:46]
The session covers basic commands like using the up and down arrows, the tab button, and the tilde symbol. R expects users to cite it in their research papers. To do this, use the command citation() and copy the output to your bibliography. Also, the session guides participants on how to install packages like "readr" and "readxl" using the "Tools" menu.
Working with Data [1:22:22]
Dr. Gaur explains the difference between variables (age, profession, income) and observations in a dataset. He also distinguishes between categorical and metric variables. Participants are guided to import a demo Excel file into R Studio using the "Import Dataset" option.
Understanding R's Perspective [1:33:55]
Even after importing data, R only understands the file name, number of observations, and number of variables. To make R "understand" the data, the attach() command is used. The head() and tail() commands are used to view the first and last few observations. The summary() command gives a basic statistical summary, but it's not very useful for categorical variables.
Data Processing [1:41:07]
To get meaningful summaries for metric variables, the summary(file$variable) command is used. To create new variables in R, the syntax variable = file$variable is used. For categorical variables, variable = as.factor(file$variable) is used.
Saving Your Work [1:51:24]
To save the work, go to "Session," then "Set Working Directory," and choose a directory. Then, go to "Session" and "Save Workspace As" to save the R data.
More Commands and Data Exploration [1:54:52]
The session covers more commands like dim() to check dimensions, length() to check the number of variables, and attributes() to list all variables. The class() command is used to check if a variable is a factor or character. The levels() command lists the categories in a factor variable.
R as a Calculator and Statistical Tests [2:00:30]
R can be used as a calculator with basic arithmetic and trigonometric functions. Statistical tests like t-tests can also be performed. The results can be stored in a variable using variable = t.test(...). Variables can be removed using the rm() command.
Combining Variables and Data Manipulation [2:06:34]
Multiple variables can be combined into a data frame using all = data.frame(var1, var2, var3). R allows you to extract specific subsets of data using square brackets. For example, file[1:7, ] extracts the first seven rows, and file[13:17, 2:5] extracts rows 13-17 and columns 2-5.
Learning Resources [2:13:41]
To learn more about any command, use ?command to open the help documentation. Dr. Gaur also recommends using the R documentation website as a free encyclopedia for learning R.
Working with SPSS Files [2:23:47]
The session explains how to import SPSS files into R Studio using "Import Dataset" and "From SPSS." The challenge is that categorical variables may not be recognized correctly. To fix this, use as.factor() and then assign labels to the categories.
Univariate Analysis and Cleaning Up [2:33:50]
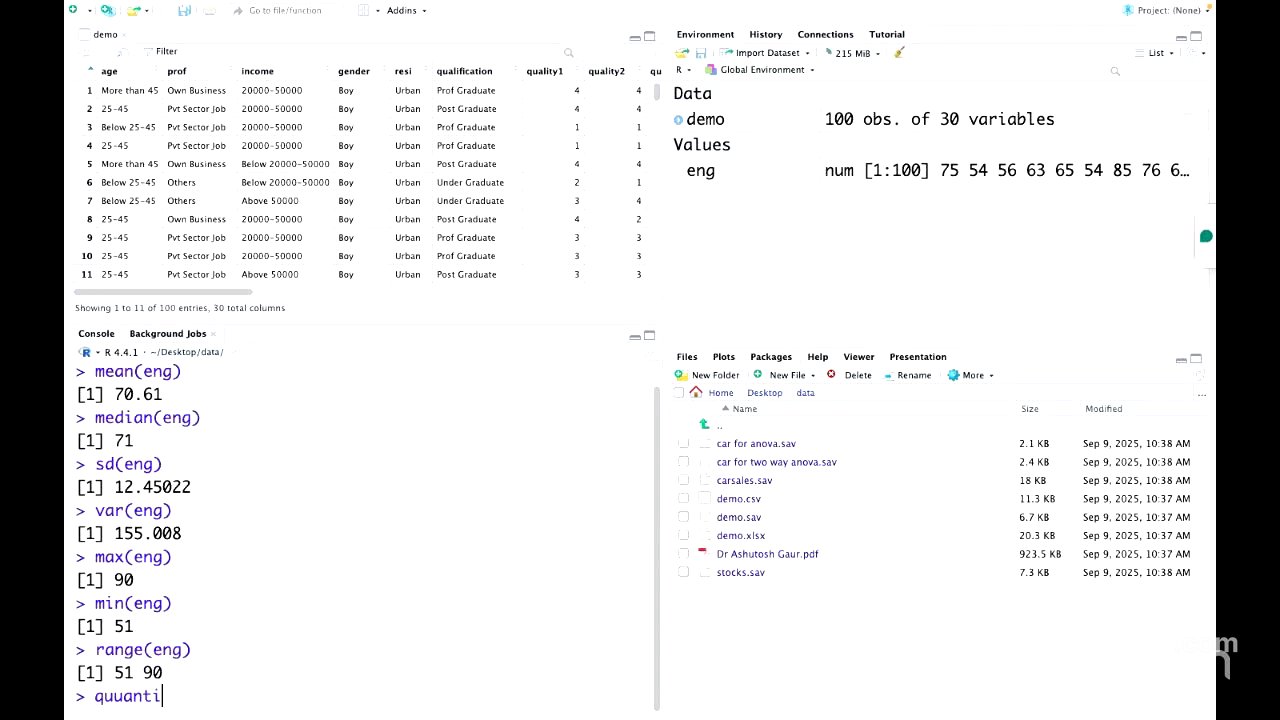
The session covers univariate analysis for metric variables, including calculating the mean, median, standard deviation, variance, range, and quartiles. To clean up the environment, use rm(list = ls()) or the broom icon.
Working with CSV Files [2:34:32]
The session demonstrates how to import CSV files into R Studio using the "Import Dataset" option or by clicking on the file in the file pane. Once imported, the same commands for data manipulation and analysis can be used.
Wrap Up and Next Steps [2:39:50]
Dr. Gaur concludes the session, encouraging participants to practice the exercises. The next session is scheduled for tomorrow at 2:40 PM, where they will continue with more advanced topics.


